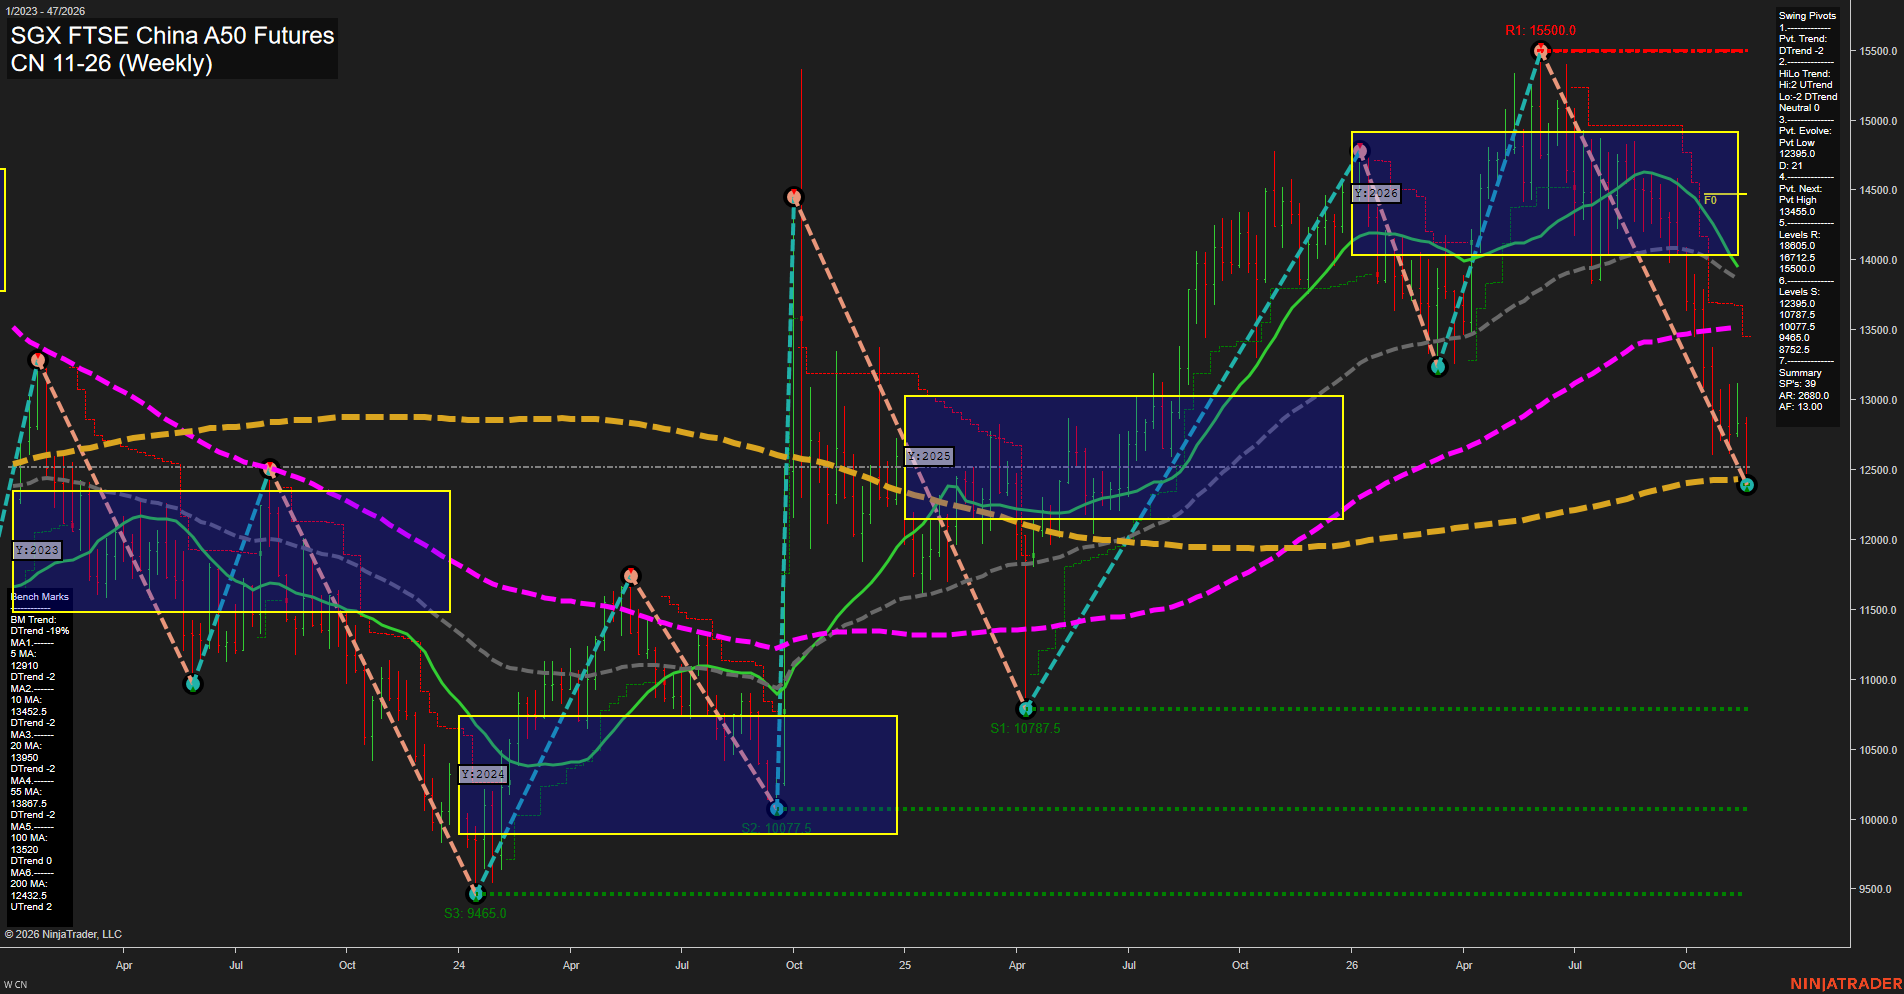
CN SGX FTSE China A50 Futures Weekly Chart Analysis — After Market Close: 2026-Nov-20 15:04 CT
Price Action
- Last: Approximately 12800,
- Bars: Large,
- Mom: Momentum fast to the downside, with a modest rebound from the latest low.
WSFG Weekly
- Near-Term
- WSFG Current: NA%
- F0%/NTZ' Bias: Price Neutral,
- WSFG Trend: Neutral.
MSFG Month Nov
- Medium-Term
- MSFG Current: NA%
- F0%/NTZ' Bias: Price Neutral,
- MSFG Trend: Neutral.
YSFG Year 2026
- Far-Term
- YSFG Current: NA%
- F0%/NTZ' Bias: Price below F0% and NTZ,
- YSFG Trend: Bearish.
Swing Pivots
- (Near-Term) 1. Pvt. Trend: DTrend,
- (Medium-Term) 2. HiLo Trend: Neutral; high pivots UTrend, low pivots DTrend,
- 3. Pvt. Evolve: Pvt low 12395.0,
- 4. Pvt. Next: Pvt high 13455.0,
- 5. Levels R: 18605.0, 16712.5, 15500.0,
- 6. Levels S: 12395.0, 10787.5, 10077.5, 9465.0, 8752.5.
Weekly Benchmarks
- (Near-Term) 5 Week: 12910 Down Trend,
- (Near-Term) 10 Week: 13452.5 Down Trend,
- (Medium-Term) 20 Week: 13950 Down Trend,
- (Medium-Term) 55 Week: 13867.5 Down Trend,
- (Far-Term) 100 Week: 13520 Down Trend, flat reading,
- (Far-Term) 200 Week: 12432.5 Up Trend.
Overall Rating
- Near-Term: Bearish,
- Medium-Term: Bearish,
- Far-Term: Neutral.
Key Insights Summary
The weekly swing structure shows a sharp decline from 15500 to an evolving low at 12395, followed by a modest rebound. Price remains below the declining 5-, 10-, 20- and 55-week benchmarks, so the rebound currently represents countertrend recovery rather than confirmed trend reversal. The next-pivot reversal threshold at 13455 closely aligns with the 10-week benchmark at 13452.5. Medium-term pivot structure is mixed, with higher highs but lower lows indicating an expanding, volatile range rather than an orderly uptrend. The 12395 low sits close to the rising 200-week benchmark at 12432.5, making this the principal long-cycle support cluster visible on the chart. Far-term evidence is mixed because price remains above that major benchmark but below the 100-week average and the 2026 yearly neutral zone. Weekly and monthly grids and the specified USAR signals are not visible; their directional contributions cannot be verified. No news or seasonal conclusion can be established from this chart alone.
Chart Analysis ATS AI Generated: 2026-11-20 15:04 for Informational use only, not trading advice. Terms and Risk Disclosure Copyright © 2026. Algo Trading Systems LLC.