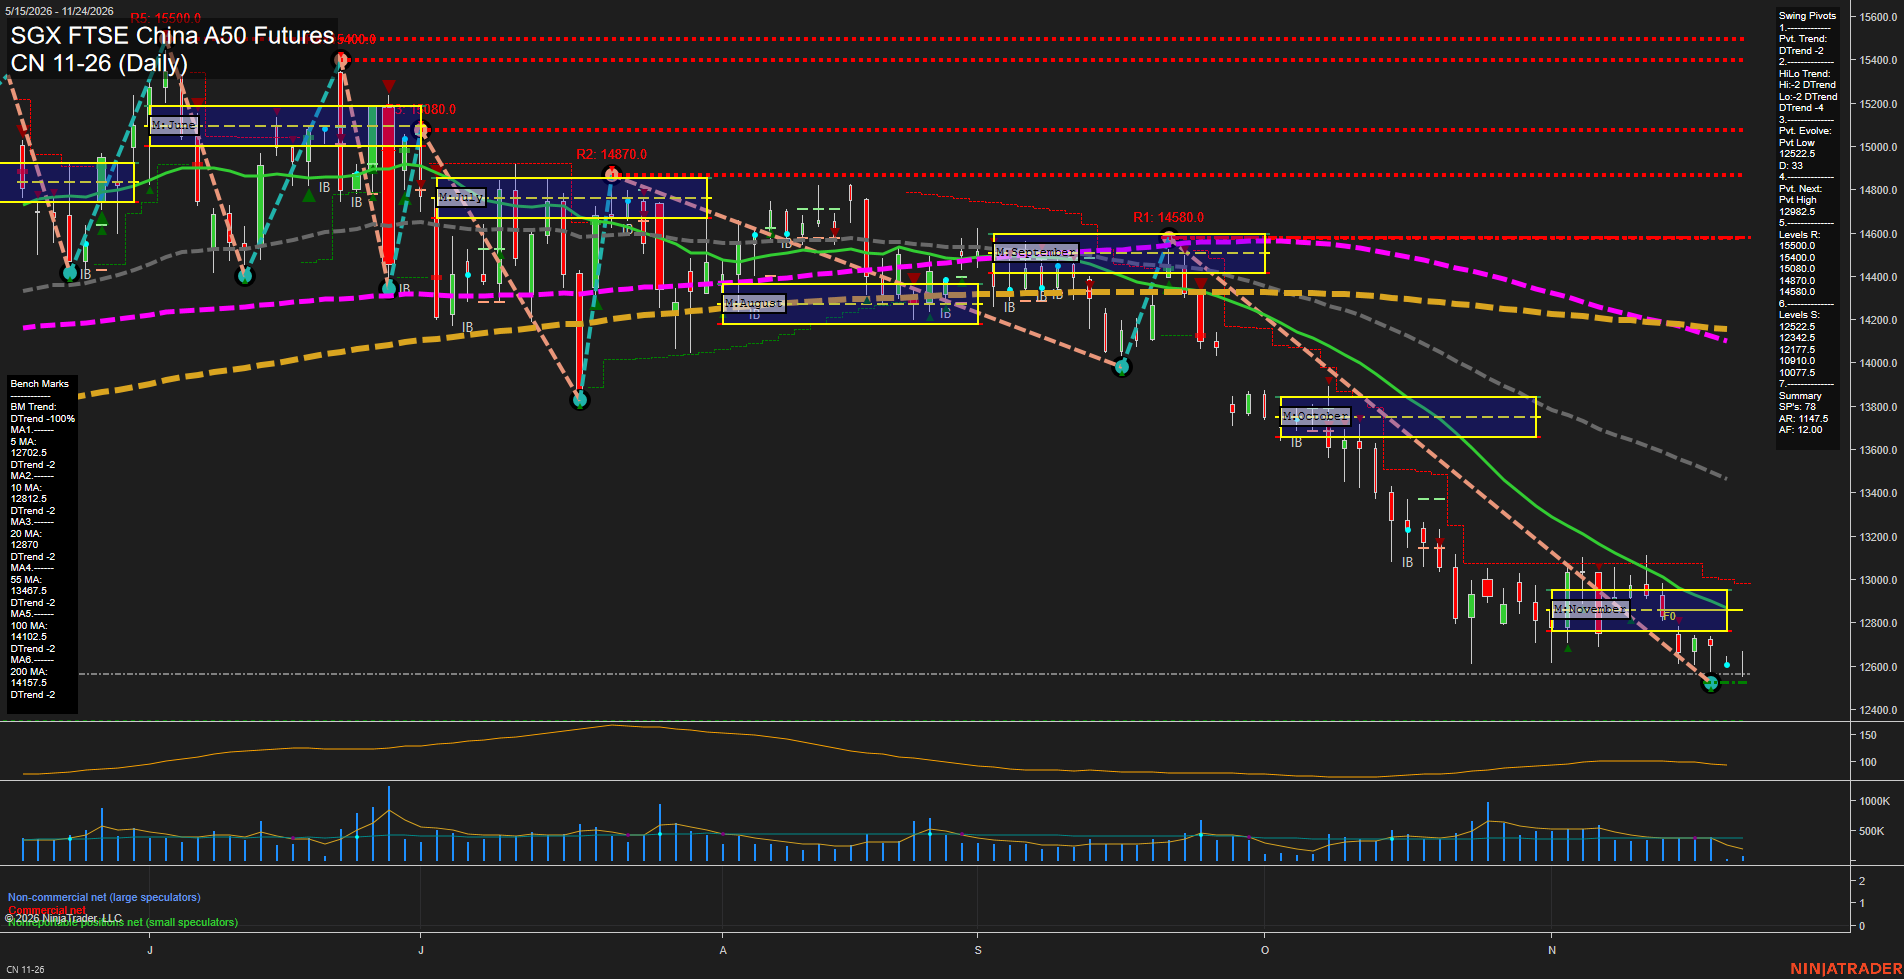
CN SGX FTSE China A50 Futures Daily Chart Analysis — After Market Close: 2026-Nov-20 15:03 CT
Price Action
- Last: Approximately 12570,
- Bars: Small,
- Mom: Slow, following a sustained decline.
WSFG Weekly
- Near-Term
- WSFG Current: NA%
- F0%/NTZ' Bias: Not visible,
- WSFG Trend: Not determinable.
MSFG Month Nov
- Medium-Term
- MSFG Current: NA%
- F0%/NTZ' Bias: Price below F0% and NTZ,
- MSFG Trend: Bearish.
YSFG Year 2026
- Far-Term
- YSFG Current: NA%
- F0%/NTZ' Bias: Not visible,
- YSFG Trend: Not determinable.
Swing Pivots
- (Near-Term) 1. Pvt. Trend: DTrend,
- (Medium-Term) 2. HiLo Trend: DTrend,
- 3. Pvt. Evolve: Pvt low 12522.5,
- 4. Pvt. Next: Pvt high 12982.5,
- 5. Levels R: 15500, 15400, 15080, 14870, 14580,
- 6. Levels S: 12522.5, 12342.5, 12177.5, 10910, 10077.5.
Daily Benchmarks
- (Near-Term) 5 Day: 12702.5 Down Trend,
- (Near-Term) 10 Day: 12812.5 Down Trend,
- (Medium-Term) 20 Day: 12870 Down Trend,
- (Medium-Term) 55 Day: 13487.5 Down Trend,
- (Far-Term) 100 Day: 14102.5 Down Trend,
- (Far-Term) 200 Day: 14157.5 Down Trend.
Additional Metrics
- ATR: Approximately 100,
- VOLMA: 532210.
Overall Rating
- Near-Term: Bearish,
- Medium-Term: Bearish,
- Far-Term: Bearish.
Key Insights Summary
From a futures swing-trading perspective, lower highs and lower lows remain the dominant structure. Price sits below all six declining benchmarks and below November’s monthly neutral zone, approximately 12770–12960. The developing pivot low at 12522.5 anchors the latest downswing; the summary identifies 12982.5 as the opposite-pivot reversal threshold. Recent small candles indicate slowing downside momentum near the lows, but do not establish a trend reversal. The nearby 5-, 10-, and 20-day averages form an overhead cluster at approximately 12703–12870, while the much higher 55-, 100-, and 200-day averages reinforce the broader bearish backdrop. ATR has eased from its recent expansion, suggesting moderating daily volatility rather than confirmed recovery. Weekly and yearly grids and the named trade-signal readings are not displayed; news and seasonal drivers cannot be established from this chart.
Chart Analysis ATS AI Generated: 2026-11-20 15:04 for Informational use only, not trading advice. Terms and Risk Disclosure Copyright © 2026. Algo Trading Systems LLC.