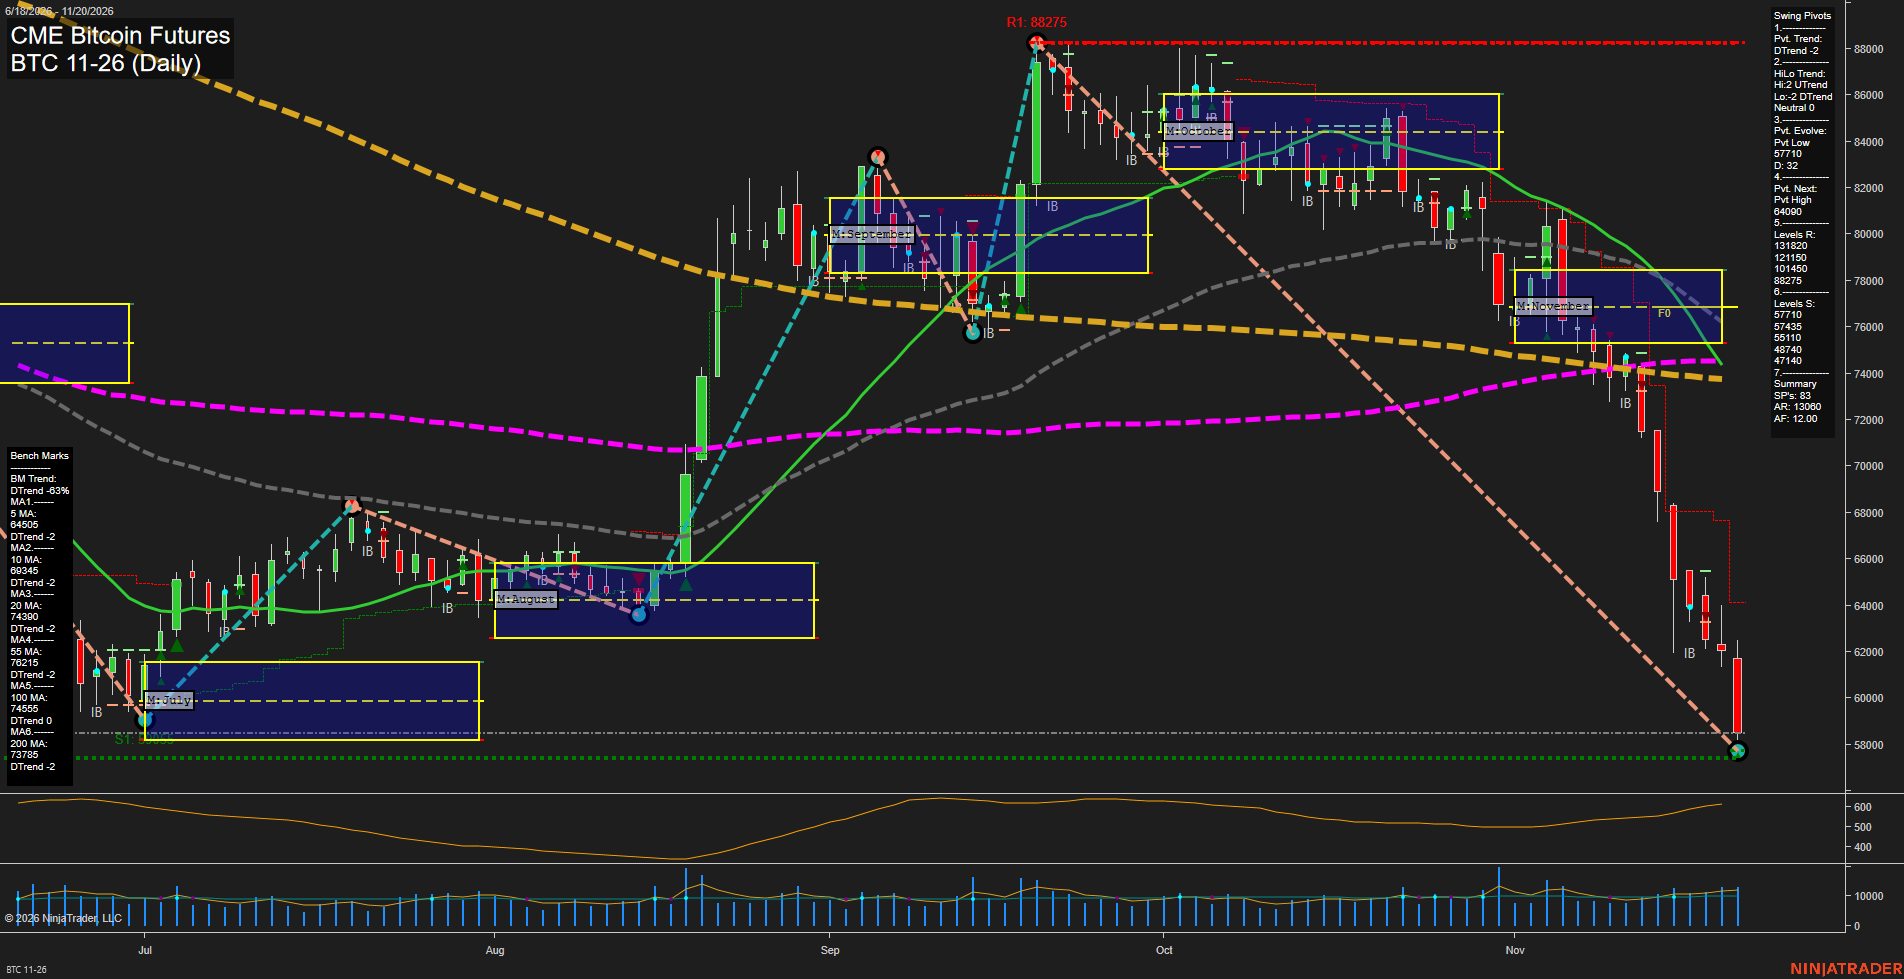
BTC CME Bitcoin Futures Daily Chart Analysis — After Market Close: 2026-Nov-20 15:02 CT
Price Action
- Last: Approximately 58,500,
- Bars: Large,
- Mom: Momentum fast.
WSFG Weekly
- Near-Term
- WSFG Current: -83%
- F0%/NTZ' Bias: Price Below,
- WSFG Trend: Down.
MSFG Month Nov
- Medium-Term
- MSFG Current: -135%
- F0%/NTZ' Bias: Price Below,
- MSFG Trend: Down.
YSFG Year 2026
- Far-Term
- YSFG Current: -115%
- F0%/NTZ' Bias: Price Below,
- YSFG Trend: Down.
Swing Pivots
- (Near-Term) 1. Pvt. Trend: DTrend,
- (Medium-Term) 2. HiLo Trend: Neutral (highs UTrend; lows DTrend),
- 3. Pvt. Evolve: Pvt low 57,710,
- 4. Pvt. Next: Pvt high 64,090,
- 5. Levels R: 131,820, 121,150, 101,450, 88,275,
- 6. Levels S: 57,710, 57,435, 55,110, 48,740, 47,140.
Daily Benchmarks
- (Near-Term) 5 Day: 64,505 Down Trend,
- (Near-Term) 10 Day: 69,345 Down Trend,
- (Medium-Term) 20 Day: 74,390 Down Trend,
- (Medium-Term) 55 Day: 76,215 Down Trend,
- (Far-Term) 100 Day: 74,555 Neutral Trend,
- (Far-Term) 200 Day: 73,785 Down Trend.
Additional Metrics
Recent Trade Signals
- 18 Nov 2026: Short BTC 11-26 @ 64615 Signals.USAR-WSFG
Overall Rating
- Near-Term: Bearish,
- Medium-Term: Bearish,
- Far-Term: Bearish.
Key Insights Summary
From a futures swing perspective, the chart shows an accelerating downside continuation rather than consolidation. Large bearish candles have carried price beneath every benchmark and below the weekly, monthly and yearly session grids. The decline from the 88,275 swing high is approaching the 57,710–57,435 support cluster, with 55,110 the next listed support. The evolving pivot remains a low; the summary identifies 64,090 as the opposite-pivot reversal threshold, not a confirmed reversal. Medium-term pivot structure is mixed, but falling 20-day and 55-day benchmarks reinforce the bearish price trend. Far-term conditions are also bearish despite the neutral 100-day benchmark. The November 18 short signal aligns with the subsequent selloff. Price is substantially extended below its moving averages, although the chart does not yet establish a recovery pattern. News catalysts and seasonal effects cannot be verified from this chart.
Chart Analysis ATS AI Generated: 2026-11-20 15:03 for Informational use only, not trading advice. Terms and Risk Disclosure Copyright © 2026. Algo Trading Systems LLC.