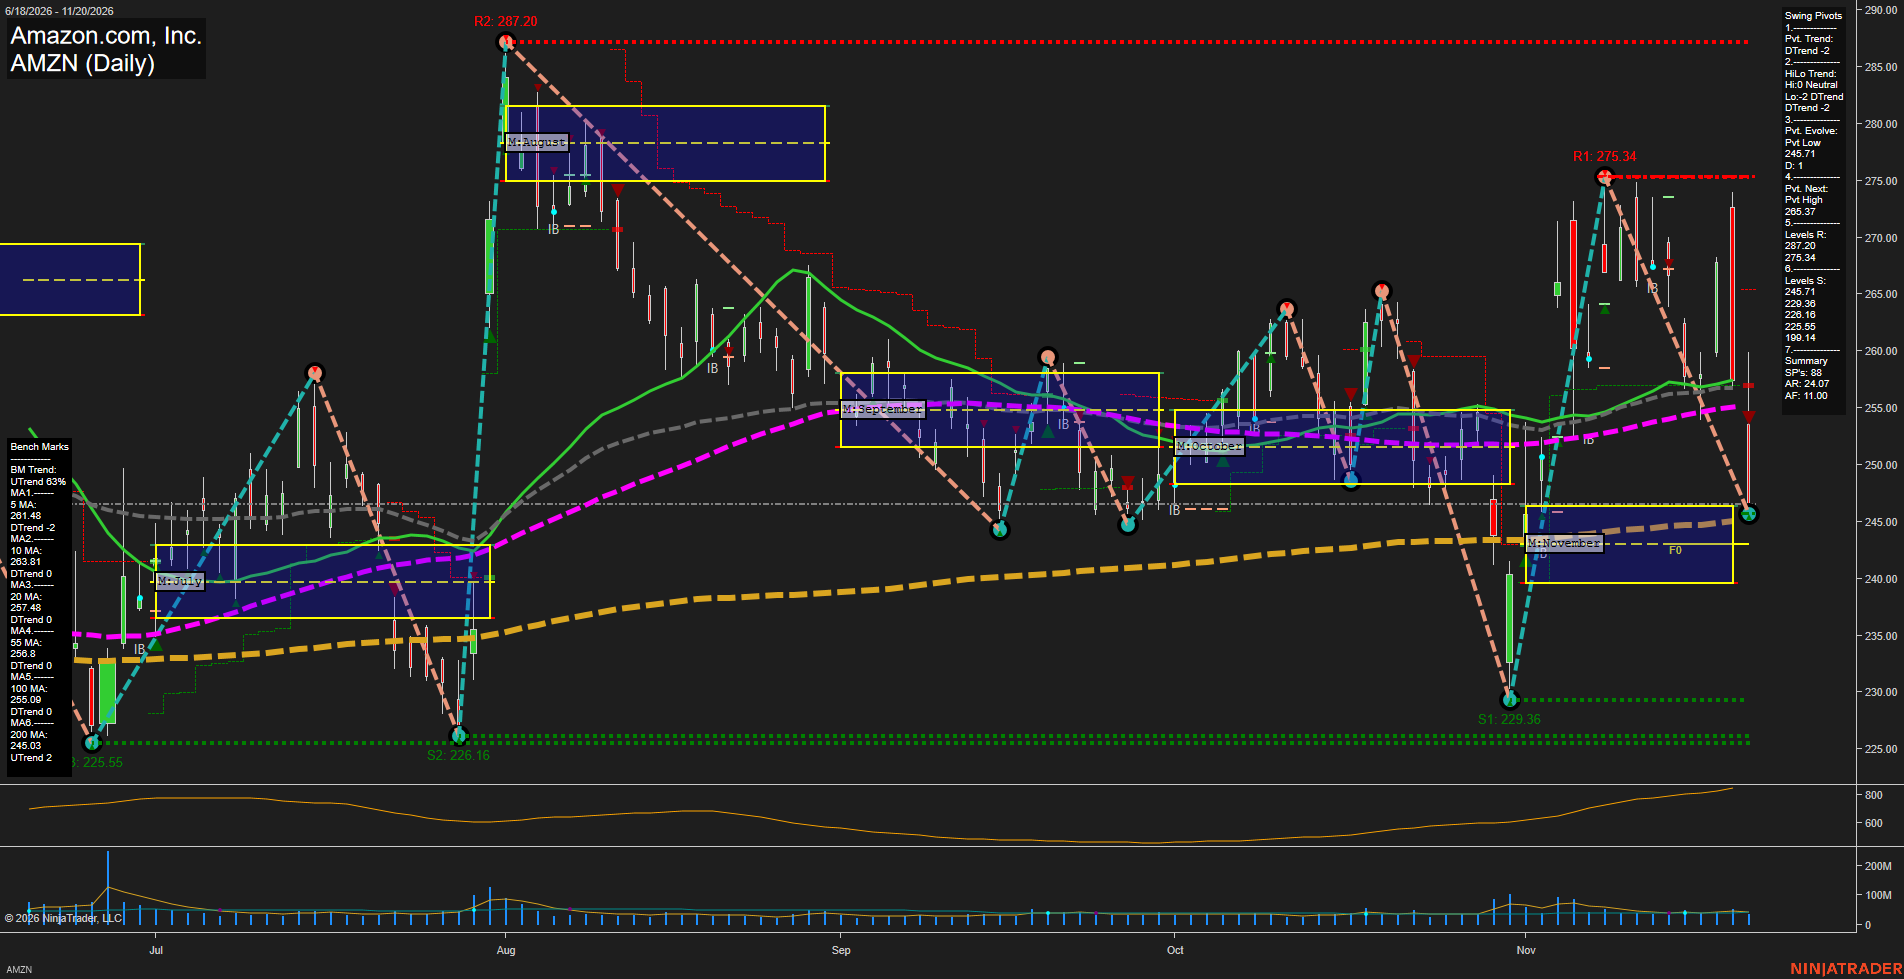
AMZN Amazon.com; Inc. Daily Chart Analysis — After Market Close: 2026-Nov-20 15:02 CT
Price Action
- Last: Approximately 257.00,
- Bars: Large,
- Mom: Momentum fast.
WSFG Weekly
- Near-Term
- WSFG Current: NA%
- F0%/NTZ' Bias: Price Neutral,
- WSFG Trend: Neutral.
MSFG Month Nov
- Medium-Term
- MSFG Current: NA%
- F0%/NTZ' Bias: Price Above NTZ,
- MSFG Trend: Bullish.
YSFG Year 2026
- Far-Term
- YSFG Current: NA%
- F0%/NTZ' Bias: Price Neutral,
- YSFG Trend: Neutral.
Swing Pivots
- (Near-Term) 1. Pvt. Trend: DTrend,
- (Medium-Term) 2. HiLo Trend: DTrend,
- 3. Pvt. Evolve: Pvt low 245.71,
- 4. Pvt. Next: Pvt high 265.37,
- 5. Levels R: 287.20, 275.34,
- 6. Levels S: 245.71, 229.36, 226.16, 225.55, 199.14.
Daily Benchmarks
- (Near-Term) 5 Day: 261.48 Down Trend,
- (Near-Term) 10 Day: 263.81 Down Trend,
- (Medium-Term) 20 Day: 257.48 Down Trend,
- (Medium-Term) 55 Day: 256.80 Down Trend,
- (Far-Term) 100 Day: 255.09 Down Trend,
- (Far-Term) 200 Day: 245.03 Up Trend.
Additional Metrics
- ATR: 465,
- VOLMA: 33608198.
Overall Rating
- Near-Term: Bearish,
- Medium-Term: Bearish,
- Far-Term: Neutral.
Key Insights Summary
From a futures swing trader’s perspective, this equity chart shows a fast, wide-range correction rather than a smooth directional trend. The retreat from 275.34 produced an evolving low at 245.71, followed by a substantial intraday recovery toward the 255–257 moving-average cluster. Near-term momentum remains bearish beneath the declining 5- and 10-day benchmarks, while both pivot trend measures remain down. Medium-term conditions are mixed but bearish overall, despite price remaining above November’s monthly neutral zone. The rising 200-day average at 245.03 sits close to the latest swing low, making that area an important structural reference. Far-term conditions remain neutral because the declining 100-day benchmark contrasts with the rising 200-day benchmark. Weekly and yearly grids and named trade-signal readings are not visible, so their neutral entries do not establish independent confirmation. The supplied additional-metric values are retained as requested; no news or seasonal catalyst can be established from this chart alone.
Chart Analysis ATS AI Generated: 2026-11-20 15:02 for Informational use only, not trading advice. Terms and Risk Disclosure Copyright © 2026. Algo Trading Systems LLC.