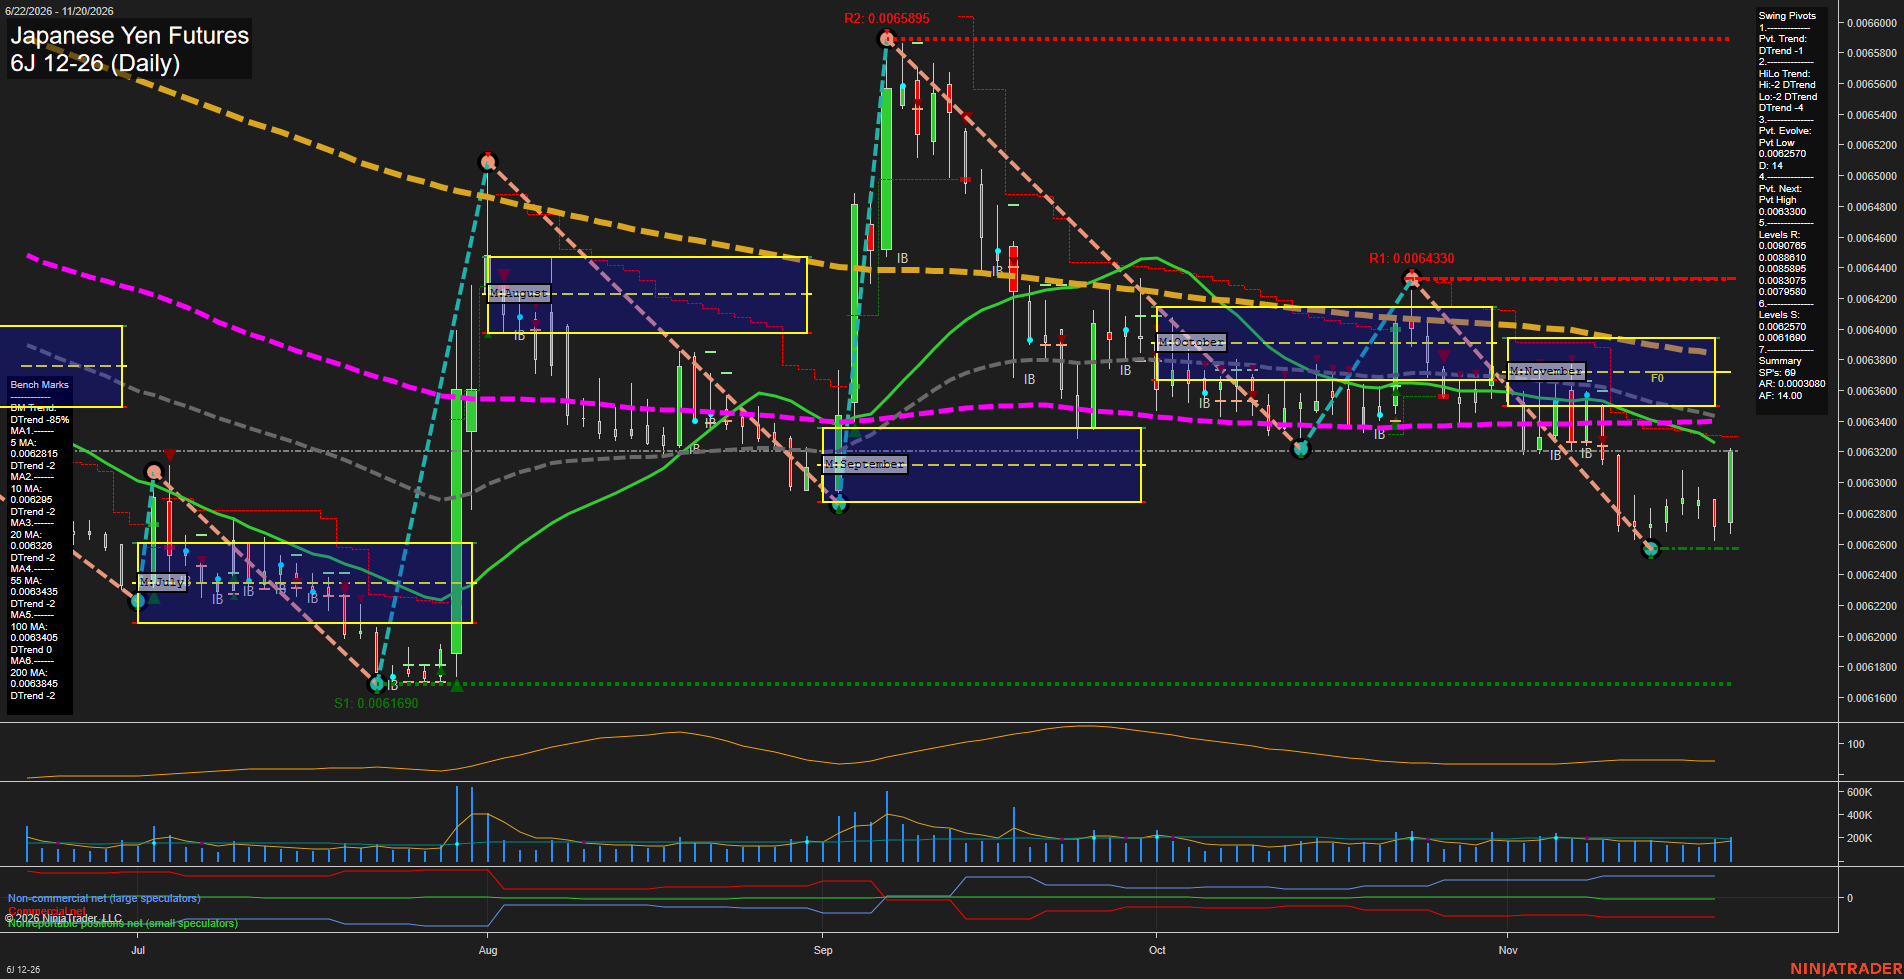
6J Japanese Yen Futures Daily Chart Analysis — After Market Close: 2026-Nov-20 15:01 CT
Price Action
- Last: approximately 0.0063200,
- Bars: Medium,
- Mom: Momentum average.
WSFG Weekly
- Near-Term
- WSFG Current: 60%
- F0%/NTZ' Bias: Price Above,
- WSFG Trend: Up.
MSFG Month Nov
- Medium-Term
- MSFG Current: -23%
- F0%/NTZ' Bias: Price Below,
- MSFG Trend: Down.
YSFG Year 2026
- Far-Term
- YSFG Current: -23%
- F0%/NTZ' Bias: Price Below,
- YSFG Trend: Down.
Swing Pivots
- (Near-Term) 1. Pvt. Trend: DTrend,
- (Medium-Term) 2. HiLo Trend: DTrend,
- 3. Pvt. Evolve: Pvt low 0.0062570,
- 4. Pvt. Next: Pvt high 0.0063300,
- 5. Levels R: 0.0090765, 0.0088010, 0.0085895, 0.0083075, 0.0079580,
- 6. Levels S: 0.0062570, 0.0061690.
Daily Benchmarks
- (Near-Term) 5 Day: 0.0062815 Down Trend,
- (Near-Term) 10 Day: 0.0062950 Down Trend,
- (Medium-Term) 20 Day: 0.0063260 Down Trend,
- (Medium-Term) 55 Day: 0.0063435 Down Trend,
- (Far-Term) 100 Day: 0.0063405 Down Trend,
- (Far-Term) 200 Day: 0.0063845 Down Trend.
Additional Metrics
Recent Trade Signals
- 20 Nov 2026: Long 6J 12-26 @ 0.006311 Signals.USAR.TR120
- 20 Nov 2026: Long 6J 12-26 @ 0.006283 Signals.USAR-WSFG
Overall Rating
- Near-Term: Bearish,
- Medium-Term: Bearish,
- Far-Term: Bearish.
Key Insights Summary
The latest bullish daily candle represents a countertrend rebound from the evolving 0.0062570 swing low. Price has recovered above the 5- and 10-day averages, with the positive weekly grid and two new long signals indicating improving short-term momentum. Nevertheless, declining near-term benchmarks and the unchanged downward pivot trend retain a bearish majority. The broader structure remains lower highs and lower lows, with price below the monthly neutral zone and all four longer benchmarks. The 20-day average at 0.0063260 and next-pivot threshold at 0.0063300 define the immediate overhead technical area. Chart-plotted resistance appears at 0.0064330 and 0.0065895; the resistance values in the Swing Pivots summary are outside the displayed price range and differ from those plotted levels. Overall, the session shows a recovery within an established downtrend rather than a confirmed trend reversal. News and seasonal catalysts cannot be established from this chart alone.
Chart Analysis ATS AI Generated: 2026-11-20 15:01 for Informational use only, not trading advice. Terms and Risk Disclosure Copyright © 2026. Algo Trading Systems LLC.