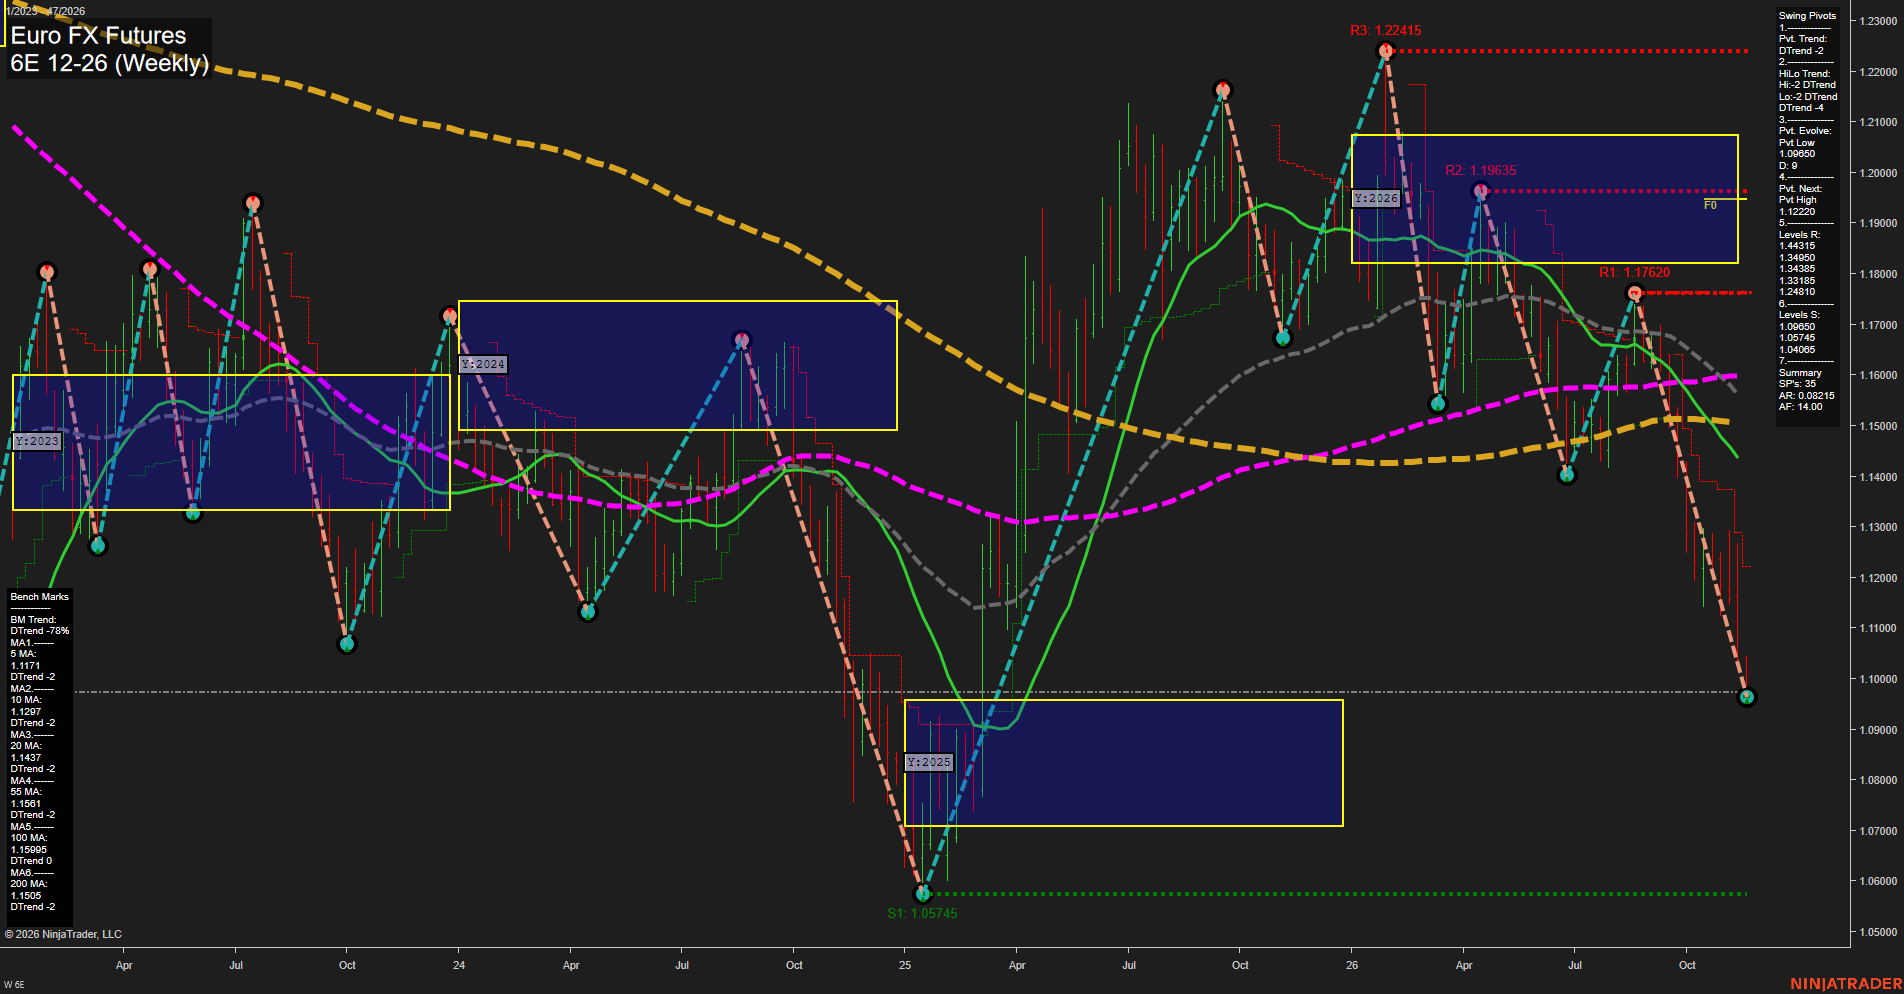
6E Euro FX Futures Weekly Chart Analysis — After Market Close: 2026-Nov-20 15:01 CT
Price Action
- Last: Approximately 1.0970,
- Bars: Large,
- Mom: Momentum fast.
WSFG Weekly
- Near-Term
- WSFG Current: -44%
- F0%/NTZ' Bias: Price Below,
- WSFG Trend: Down.
MSFG Month Nov
- Medium-Term
- MSFG Current: -81%
- F0%/NTZ' Bias: Price Below,
- MSFG Trend: Down.
YSFG Year 2026
- Far-Term
- YSFG Current: -76%
- F0%/NTZ' Bias: Price Below,
- YSFG Trend: Down.
Swing Pivots
- (Near-Term) 1. Pvt. Trend: DTrend,
- (Medium-Term) 2. HiLo Trend: DTrend,
- 3. Pvt. Evolve: Pvt low 1.09650,
- 4. Pvt. Next: Pvt high 1.12220,
- 5. Levels R: 1.44315, 1.34950, 1.34385, 1.33185, 1.24810,
- 6. Levels S: 1.09650, 1.05745, 1.04065.
Weekly Benchmarks
- (Near-Term) 5 Week: 1.1171 Down Trend,
- (Near-Term) 10 Week: 1.1297 Down Trend,
- (Medium-Term) 20 Week: 1.1437 Down Trend,
- (Medium-Term) 55 Week: 1.1561 Down Trend,
- (Far-Term) 100 Week: 1.15995 Down Trend,
- (Far-Term) 200 Week: 1.1505 Down Trend.
Recent Trade Signals
- 17 Nov 2026: Short 6E 12-26 @ 1.1008 Signals.USAR-WSFG
Overall Rating
- Near-Term: Bearish,
- Medium-Term: Bearish,
- Far-Term: Bearish.
Key Insights Summary
The weekly structure reflects a fast bearish continuation rather than consolidation: successive lower highs and lower lows culminate in a test of the evolving 1.09650 pivot low. Price is below every benchmark and all three session-grid neutral zones, aligning the swing-trading outlook bearishly across time frames. The 100-week benchmark has a DTrend reading of 0, indicating little current slope despite price remaining well below it. The 1.12220 next-pivot threshold defines the chart's near-term reversal reference, while 1.05745 is the next listed support below the current low. The pivot summary's resistance list differs from the visible local resistance lines at 1.17620, 1.19635 and 1.22415; the levels above reproduce the requested summary. Only the supplied WSFG short signal is available for signal confirmation. News catalysts and seasonal effects cannot be established from this chart alone.
Chart Analysis ATS AI Generated: 2026-11-20 15:01 for Informational use only, not trading advice. Terms and Risk Disclosure Copyright © 2026. Algo Trading Systems LLC.