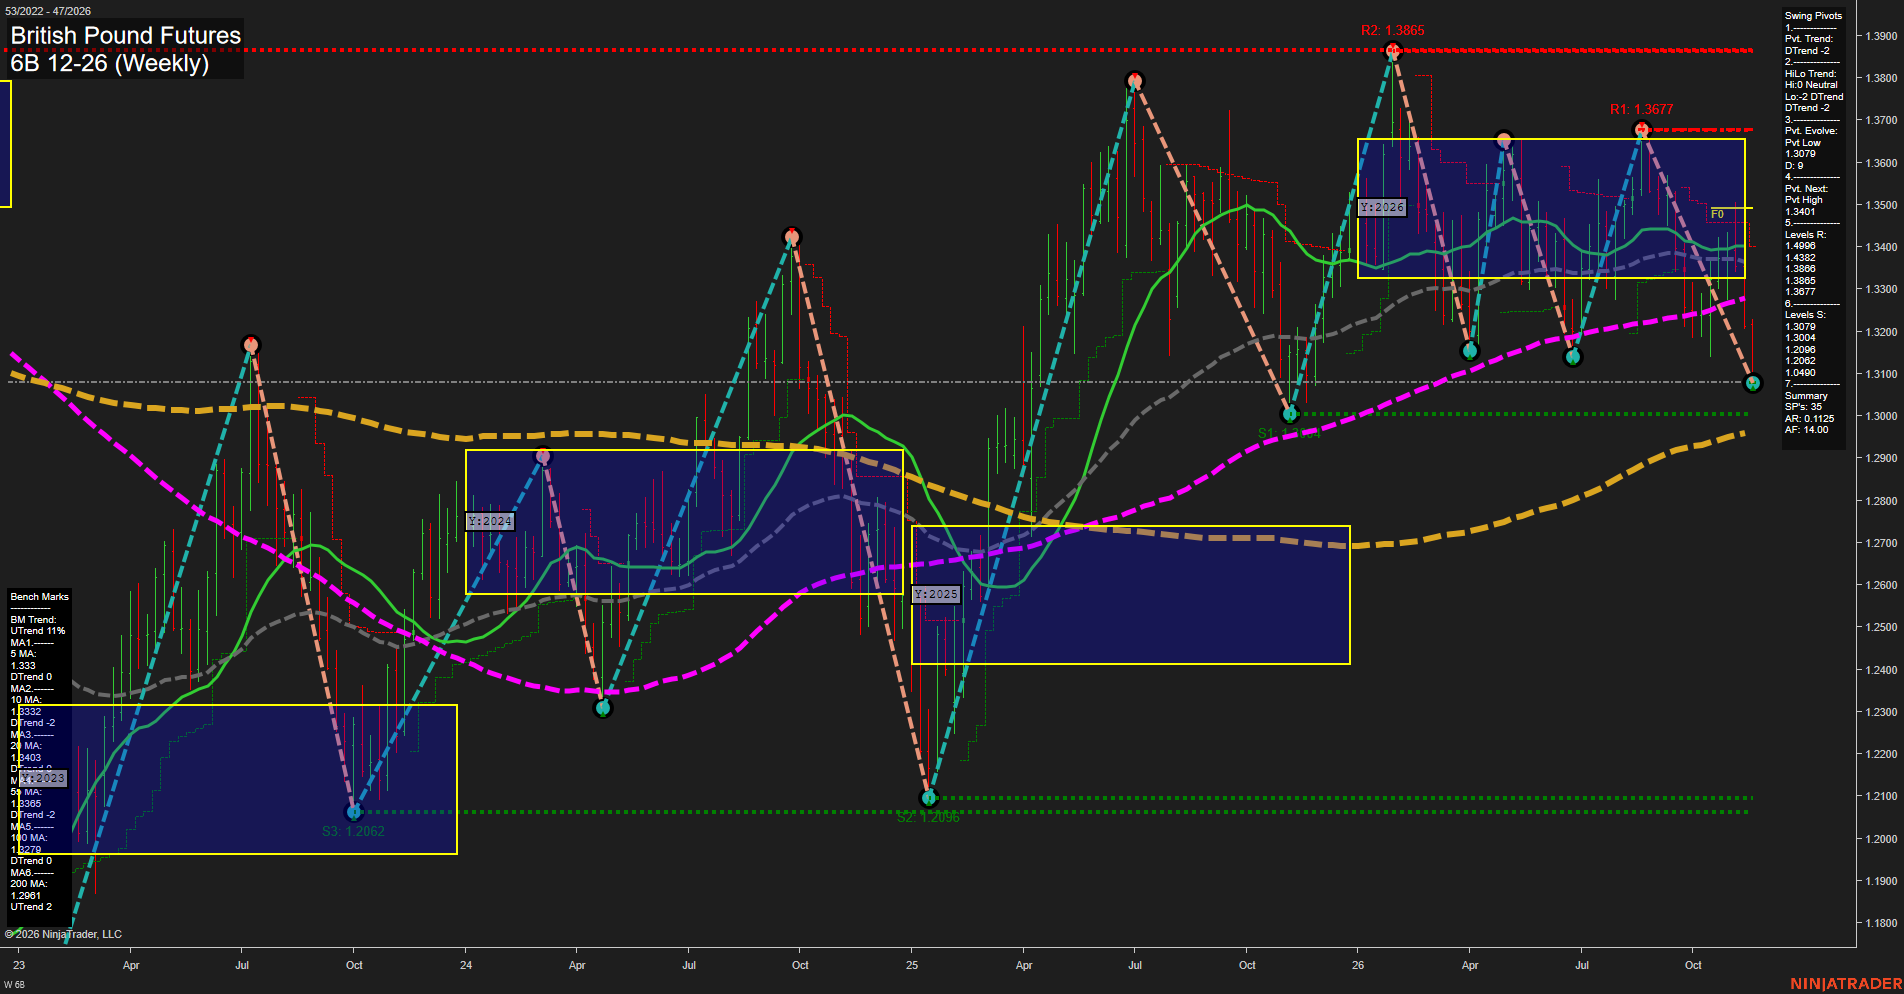
6B British Pound Futures Weekly Chart Analysis — After Market Close: 2026-Nov-20 15:00 CT
Price Action
- Last: Approximately 1.3080,
- Bars: Medium,
- Mom: Momentum fast.
WSFG Weekly
- Near-Term
- WSFG Current: -83%
- F0%/NTZ' Bias: Price Below,
- WSFG Trend: Down.
MSFG Month Nov
- Medium-Term
- MSFG Current: -109%
- F0%/NTZ' Bias: Price Below,
- MSFG Trend: Down.
YSFG Year 2026
- Far-Term
- YSFG Current: -25%
- F0%/NTZ' Bias: Price Below,
- YSFG Trend: Down.
Swing Pivots
- (Near-Term) 1. Pvt. Trend: DTrend,
- (Medium-Term) 2. HiLo Trend: DTrend,
- 3. Pvt. Evolve: Pvt low 1.3079,
- 4. Pvt. Next: Pvt high 1.3401,
- 5. Levels R: 1.4996, 1.4382, 1.3886, 1.3865, 1.3677,
- 6. Levels S: 1.3079, 1.3004, 1.2096, 1.2062, 1.0490.
Weekly Benchmarks
- (Near-Term) 5 Week: 1.3333 Down Trend,
- (Near-Term) 10 Week: 1.3332 Down Trend,
- (Medium-Term) 20 Week: 1.3403 Down Trend,
- (Medium-Term) 55 Week: 1.3365 Down Trend,
- (Far-Term) 100 Week: 1.3279 Down Trend,
- (Far-Term) 200 Week: 1.2961 Up Trend.
Recent Trade Signals
- 17 Nov 2026: Short 6B 12-26 @ 1.3189 Signals.USAR-WSFG
Overall Rating
- Near-Term: Bearish,
- Medium-Term: Bearish,
- Far-Term: Bearish.
Key Insights Summary
The weekly swing structure favors sellers, with the decline from 1.3677 extending beneath earlier 2026 swing lows and evolving toward 1.3079. Price is below the yearly neutral zone and all benchmarks except the rising 200-week average, confirming broad technical weakness rather than an isolated near-term pullback. Weekly and monthly grid readings reinforce downside momentum, consistent with the reported short signal. Immediate support is concentrated at 1.3079 and 1.3004, with the 200-week benchmark at 1.2961 providing longer-cycle context. The 1.3279–1.3403 benchmark cluster represents overhead resistance, while 1.3401 is the reported opposite-pivot reversal threshold. Far-term conditions remain bearish overall, although the rising 200-week average shows that the longest-term trend has not fully aligned with the current selloff. News catalysts and seasonal effects cannot be established from this chart alone.
Chart Analysis ATS AI Generated: 2026-11-20 15:01 for Informational use only, not trading advice. Terms and Risk Disclosure Copyright © 2026. Algo Trading Systems LLC.