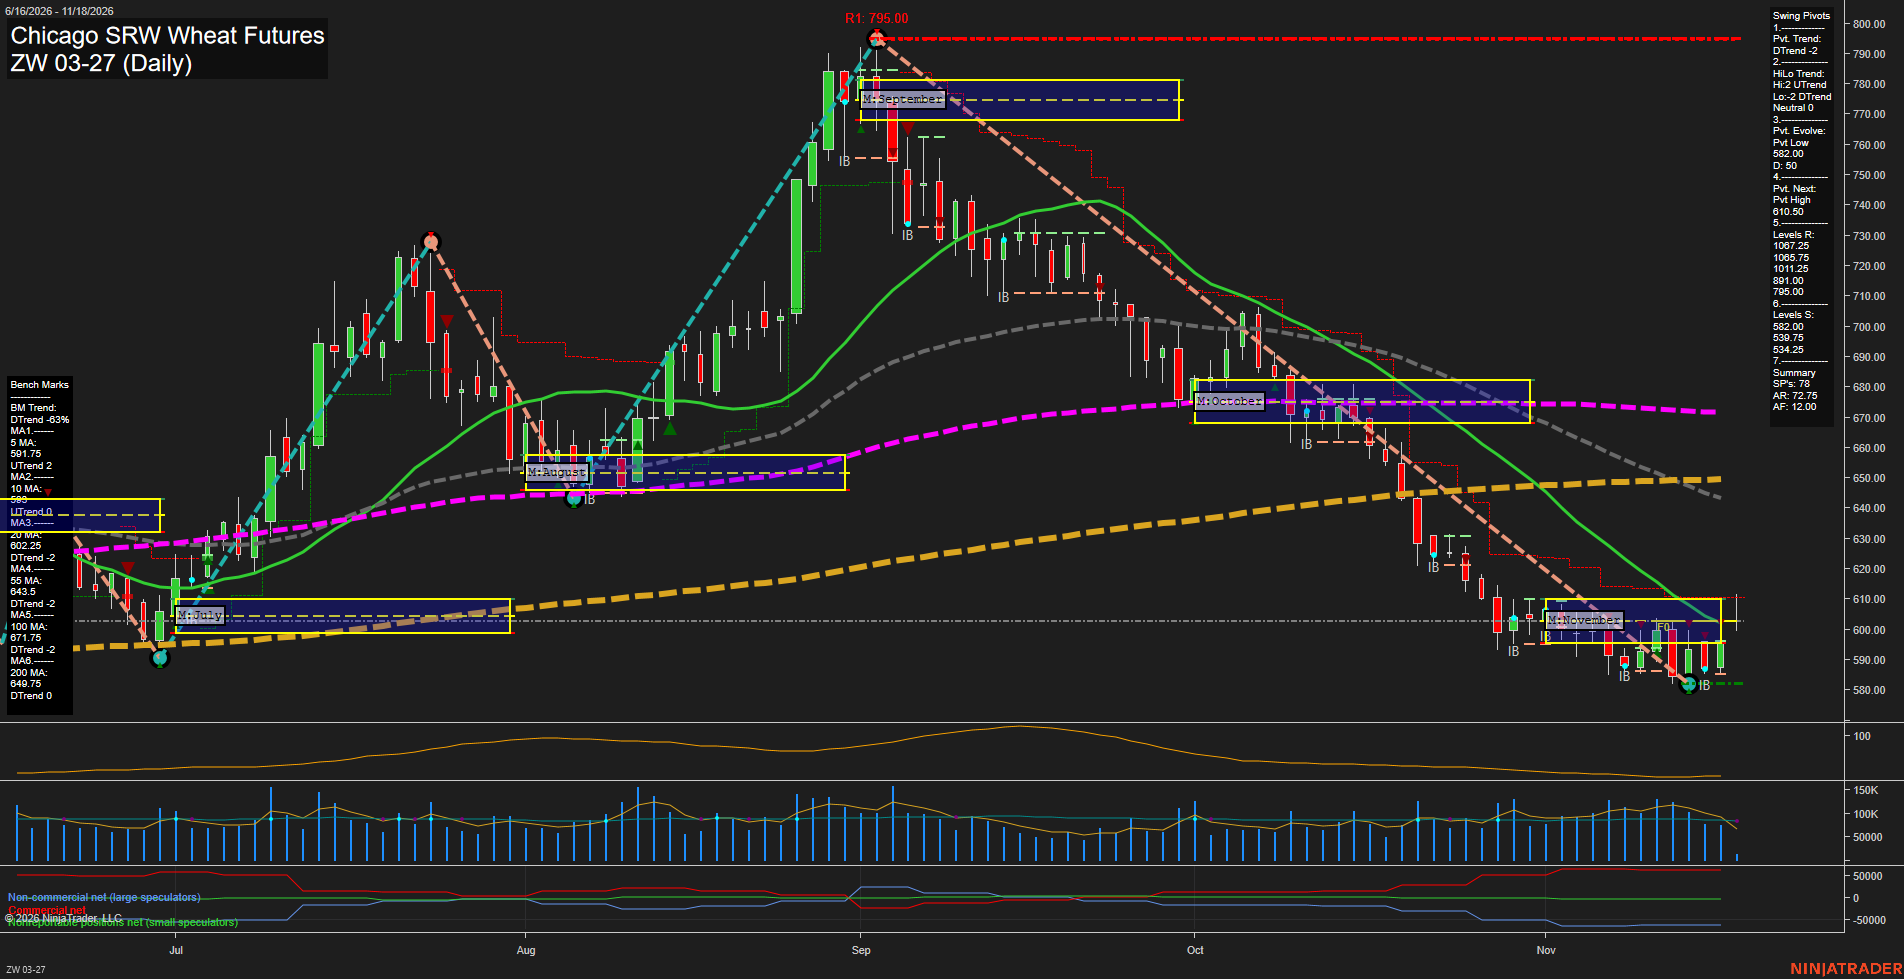
ZW Chicago SRW Wheat Futures Daily Chart Analysis — Pre-Open: 2026-Nov-18 07:19 CT
Price Action
- Last: Approximately 603,
- Bars: Medium,
- Mom: Momentum slow.
WSFG Weekly
- Near-Term
- WSFG Current: 22%
- F0%/NTZ' Bias: Price Above,
- WSFG Trend: Up.
MSFG Month Nov
- Medium-Term
- MSFG Current: 0%
- F0%/NTZ' Bias: Price Neutral,
- MSFG Trend: Neutral.
YSFG Year 2026
- Far-Term
- YSFG Current: 22%
- F0%/NTZ' Bias: Price Above,
- YSFG Trend: Up.
Swing Pivots
- (Near-Term) 1. Pvt. Trend: DTrend,
- (Medium-Term) 2. HiLo Trend: Neutral,
- 3. Pvt. Evolve: Pvt low 582.00,
- 4. Pvt. Next: Pvt high 610.50,
- 5. Levels R: 1067.25, 1063.75, 1011.25, 891.00, 795.00,
- 6. Levels S: 582.00, 539.75, 534.25.
Daily Benchmarks
- (Near-Term) 5 Day: 591.75 Up Trend,
- (Near-Term) 10 Day: 598 Up Trend,
- (Medium-Term) 20 Day: 602.25 Down Trend,
- (Medium-Term) 55 Day: 643.5 Down Trend,
- (Far-Term) 100 Day: 671.75 Down Trend,
- (Far-Term) 200 Day: 649.75 Down Trend.
Additional Metrics
Recent Trade Signals
- 16 Nov 2026: Short ZW 12-26 @ 589.5 Signals.USAR-MSFG
- 13 Nov 2026: Long ZW 12-26 @ 597 Signals.USAR-WSFG
- 11 Nov 2026: Long ZW 12-26 @ 602.25 Signals.USAR.TR120
Overall Rating
- Near-Term: Bullish,
- Medium-Term: Bearish,
- Far-Term: Bearish.
Key Insights Summary
The swing-trading picture is a near-term countertrend rebound within the broader decline from September’s 795 peak. Price has recovered from the evolving 582 pivot low to approximately 603, reclaiming the rising five- and ten-day benchmarks and testing the declining 20-day average inside November’s neutral zone. Weekly grid strength and the two recent near-term long signals give the near-term evidence a bullish majority, although the pivot trend remains down and 610.50 is the displayed opposite-pivot reversal threshold. Medium-term evidence remains bearish given the declining 20- and 55-day averages and the latest monthly-system short signal. Far-term yearly-grid strength conflicts with price below both long-term benchmarks; the 100-day average is declining, while the 200-day summary has a down designation with a zero trend count, indicating little directional progression. The displayed chart is March 2027, whereas the supplied trade signals reference December 2026, so their quoted prices are not directly equivalent. No news catalyst or seasonal conclusion can be established from this chart alone.
Chart Analysis ATS AI Generated: 2026-11-18 07:19 for Informational use only, not trading advice. Terms and Risk Disclosure Copyright © 2026. Algo Trading Systems LLC.