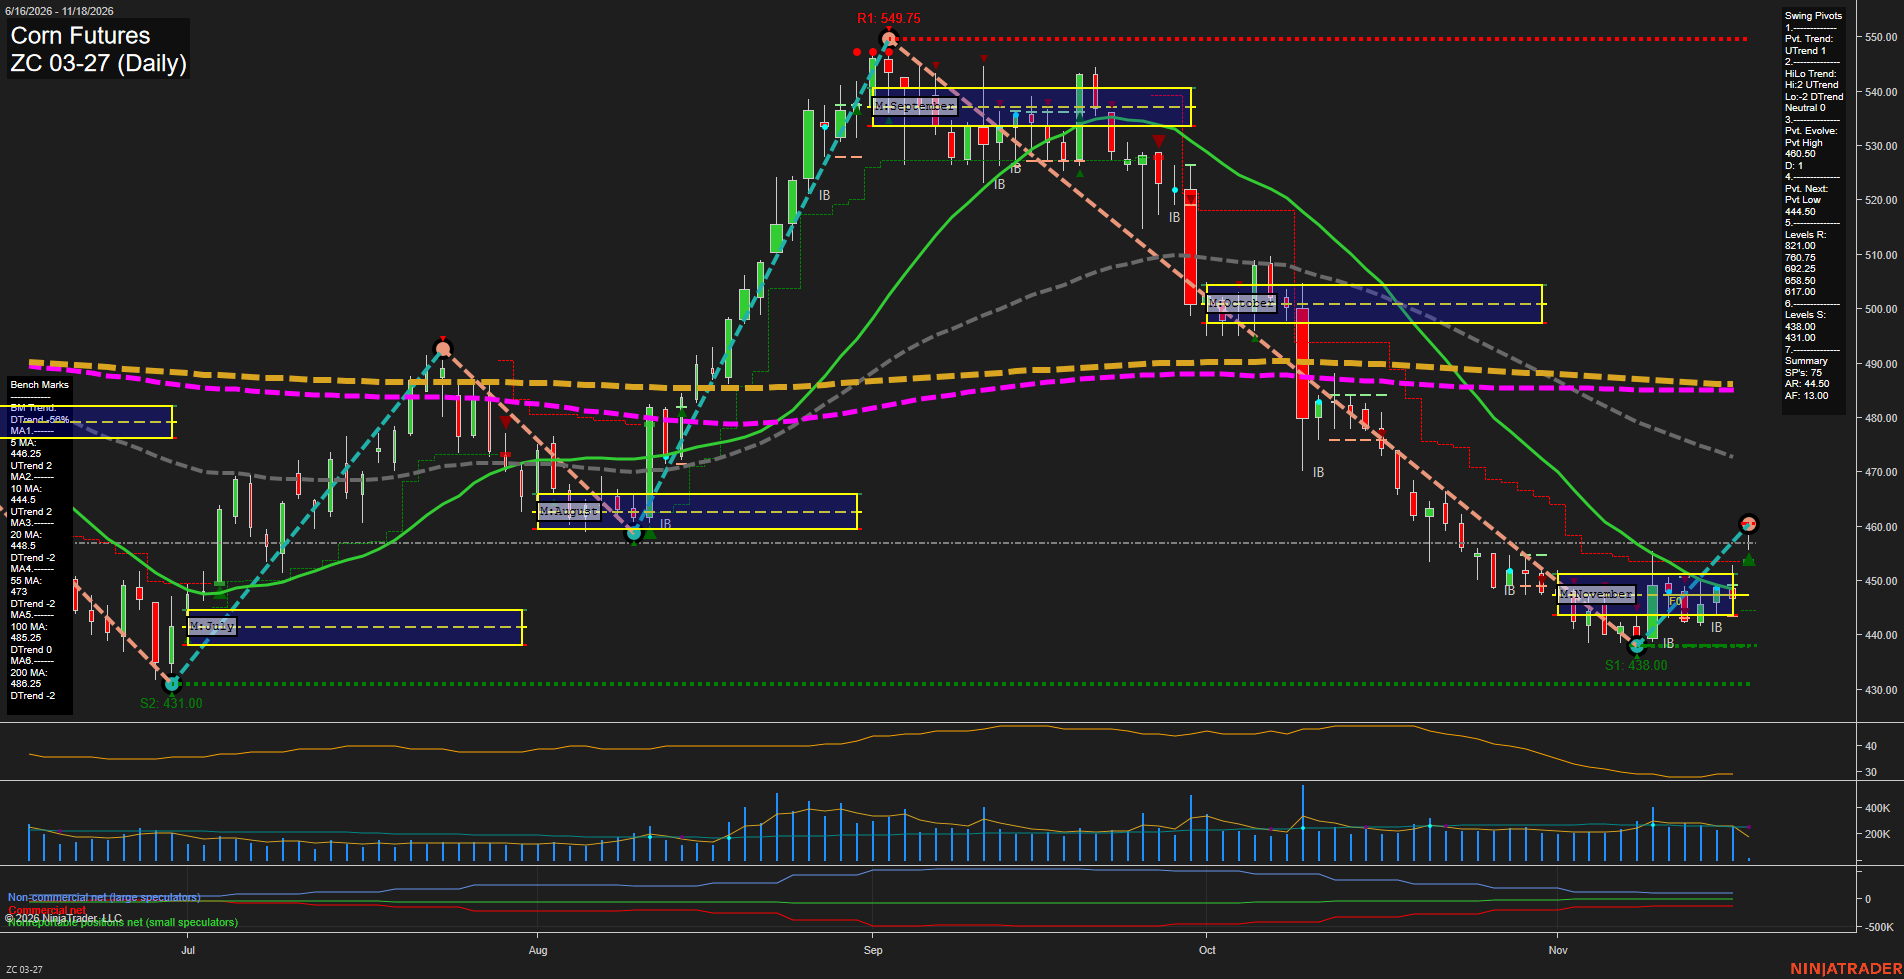
ZC Corn Futures Daily Chart Analysis — Pre-Open: 2026-Nov-18 07:18 CT
Price Action
- Last: Approximately 448.5,
- Bars: Small,
- Mom: Momentum slow.
WSFG Weekly
- Near-Term
- WSFG Current: 73%
- F0%/NTZ' Bias: Price Above,
- WSFG Trend: Up.
MSFG Month Nov
- Medium-Term
- MSFG Current: 17%
- F0%/NTZ' Bias: Price Above,
- MSFG Trend: Up.
YSFG Year 2026
- Far-Term
- YSFG Current: -31%
- F0%/NTZ' Bias: Price Below,
- YSFG Trend: Down.
Swing Pivots
- (Near-Term) 1. Pvt. Trend: UTrend,
- (Medium-Term) 2. HiLo Trend: Neutral,
- 3. Pvt. Evolve: Pvt high 460.50,
- 4. Pvt. Next: Pvt low 444.50,
- 5. Levels R: 821.00, 760.75, 692.25, 658.50, 617.00,
- 6. Levels S: 438.00, 431.00.
Daily Benchmarks
- (Near-Term) 5 Day: 446.25 Up Trend,
- (Near-Term) 10 Day: 444.5 Up Trend,
- (Medium-Term) 20 Day: 448.8 Down Trend,
- (Medium-Term) 55 Day: 473 Down Trend,
- (Far-Term) 100 Day: 485.25 Down Trend,
- (Far-Term) 200 Day: 486.25 Down Trend.
Additional Metrics
Recent Trade Signals
- 16 Nov 2026: Long ZC 12-26 @ 448.5 Signals.USAR-WSFG
- 10 Nov 2026: Short ZC 12-26 @ 440.75 Signals.USAR-MSFG
Overall Rating
- Near-Term: Bullish,
- Medium-Term: Bearish,
- Far-Term: Bearish.
Key Insights Summary
The swing-trading picture is a near-term recovery within a broader downtrend. Rising 5- and 10-day benchmarks and the upward pivot trend support the bounce from 438, but small, overlapping bars show limited momentum around the declining 20-day average. The monthly grid has turned positive while the 55-day benchmark remains substantially overhead, leaving the medium-term recovery unconfirmed. The pivot summary shows a developing high at 460.50 and the next low-pivot reversal threshold at 444.50; established supports are 438 and 431. Its HiLo classification is neutral, reflecting opposing high- and low-pivot trends. Resistance values above are transcribed from the summary and sit well beyond the visible price range. The recent weekly long signal contrasts with the earlier monthly short signal, consistent with a countertrend rebound. The chart displays ZC 03-27, whereas the supplied signals reference ZC 12-26; their prices are not directly interchangeable. No current news catalyst is established by this chart.
Chart Analysis ATS AI Generated: 2026-11-18 07:18 for Informational use only, not trading advice. Terms and Risk Disclosure Copyright © 2026. Algo Trading Systems LLC.