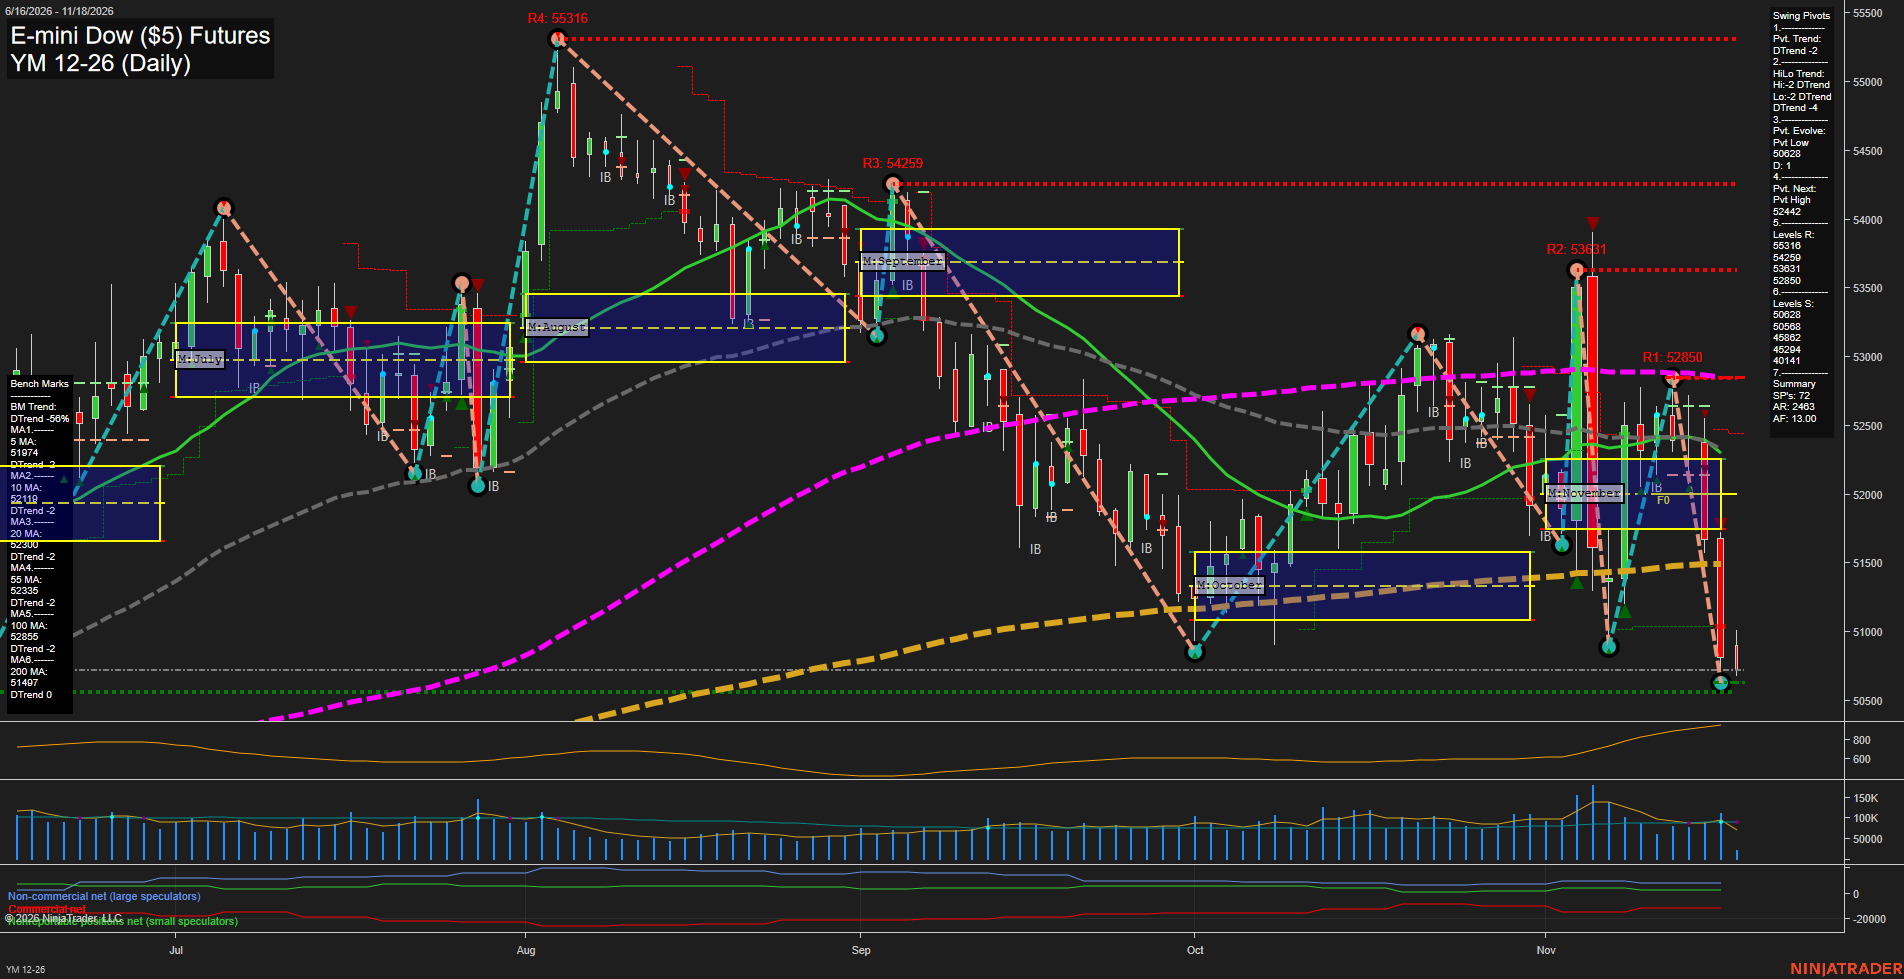
YM E-mini Dow ($5) Futures Daily Chart Analysis — Pre-Open: 2026-Nov-18 07:17 CT
Price Action
- Last: approximately 50725,
- Bars: Large,
- Mom: Momentum fast.
WSFG Weekly
- Near-Term
- WSFG Current: -91%
- F0%/NTZ' Bias: Price Below,
- WSFG Trend: Down.
MSFG Month Nov
- Medium-Term
- MSFG Current: -57%
- F0%/NTZ' Bias: Price Below,
- MSFG Trend: Down.
YSFG Year 2026
- Far-Term
- YSFG Current: 9%
- F0%/NTZ' Bias: Price Above,
- YSFG Trend: Up.
Swing Pivots
- (Near-Term) 1. Pvt. Trend: DTrend,
- (Medium-Term) 2. HiLo Trend: DTrend,
- 3. Pvt. Evolve: Pvt low 50628,
- 4. Pvt. Next: Pvt high 52442,
- 5. Levels R: 55316, 54259, 53631, 52850,
- 6. Levels S: 50628, 50568, 45862, 45294, 40141.
Daily Benchmarks
- (Near-Term) 5 Day: 51974 Down Trend,
- (Near-Term) 10 Day: 52119 Down Trend,
- (Medium-Term) 20 Day: 52300 Down Trend,
- (Medium-Term) 55 Day: 52335 Down Trend,
- (Far-Term) 100 Day: 52855 Down Trend,
- (Far-Term) 200 Day: 51497 Down Trend.
Additional Metrics
Recent Trade Signals
- 16 Nov 2026: Short YM 12-26 @ 51715 Signals.USAR-MSFG
- 16 Nov 2026: Short YM 12-26 @ 52148 Signals.USAR.TR120
- 16 Nov 2026: Short YM 12-26 @ 52178 Signals.USAR-WSFG
Overall Rating
- Near-Term: Bearish,
- Medium-Term: Bearish,
- Far-Term: Bearish.
Key Insights Summary
From a futures swing trader’s perspective, the dominant structure is a bearish continuation following a failed November rebound. Lower pivot highs and lows, negative weekly and monthly grids, and price beneath all six benchmarks reinforce the downside alignment. The latest downswing has broken beneath the 200-day benchmark and is testing the closely spaced 50628–50568 support area. Large selloff bars and ATR of 738 indicate elevated daily volatility, although the latest developing bar is comparatively small. The 52850 pivot marks the most recent lower-high resistance, while 52442 is the summary’s next pivot-reversal threshold. The positive yearly grid remains a counterpoint, but the far-term benchmark evidence favors a bearish rating. The supplied short signals agree across near- and medium-term horizons; no TR720 signal is supplied. News catalysts and seasonal effects cannot be established from this chart alone.
Chart Analysis ATS AI Generated: 2026-11-18 07:17 for Informational use only, not trading advice. Terms and Risk Disclosure Copyright © 2026. Algo Trading Systems LLC.