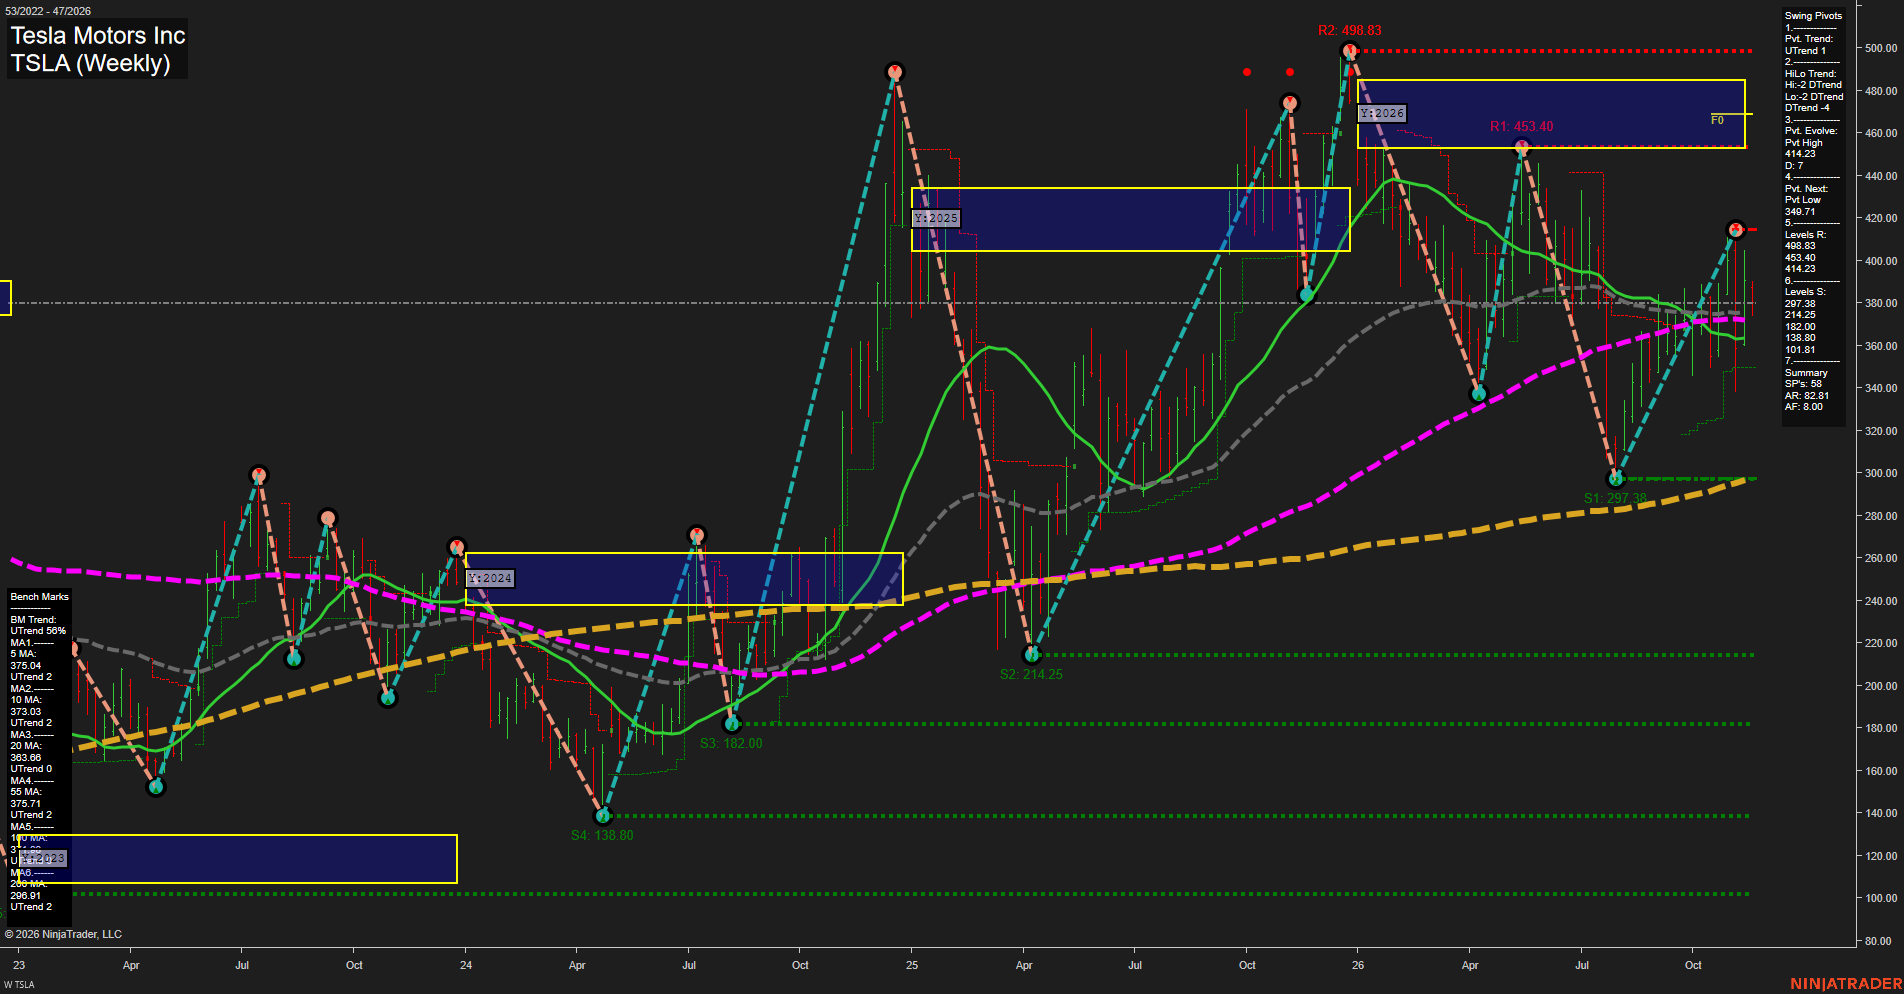
TSLA Tesla Motors Inc Weekly Chart Analysis — Pre-Open: 2026-Nov-18 07:16 CT
Price Action
- Last: Approximately 380.00,
- Bars: Large,
- Mom: Momentum average.
WSFG Weekly
- Near-Term
- WSFG Current: NA%
- F0%/NTZ' Bias: Price Neutral,
- WSFG Trend: Neutral.
MSFG Month Nov
- Medium-Term
- MSFG Current: NA%
- F0%/NTZ' Bias: Price Neutral,
- MSFG Trend: Neutral.
YSFG Year 2026
- Far-Term
- YSFG Current: NA%
- F0%/NTZ' Bias: Price below NTZ,
- YSFG Trend: Bearish.
Swing Pivots
- (Near-Term) 1. Pvt. Trend: UTrend,
- (Medium-Term) 2. HiLo Trend: DTrend,
- 3. Pvt. Evolve: Pvt high 414.23,
- 4. Pvt. Next: Pvt low 349.71,
- 5. Levels R: 498.83, 453.40, 414.23,
- 6. Levels S: 297.38, 214.25, 182.00, 138.80, 101.81.
Weekly Benchmarks
- (Near-Term) 5 Week: 375.04 Up Trend,
- (Near-Term) 10 Week: 373.03 Up Trend,
- (Medium-Term) 20 Week: 363.66 Up Trend,
- (Medium-Term) 55 Week: 375.71 Up Trend,
- (Far-Term) 100 Week: Approximately 372 Up Trend,
- (Far-Term) 200 Week: 298.01 Up Trend.
Overall Rating
- Near-Term: Bullish,
- Medium-Term: Neutral,
- Far-Term: Neutral.
Key Insights Summary
From a futures swing trader’s perspective, TSLA shows a near-term recovery within a broader corrective structure, rather than a confirmed medium-term trend reversal. Price is above the clustered weekly benchmarks around 364–376, but the retreat from the evolving 414.23 pivot high reflects two-way volatility. The medium-term lower-high/lower-low sequence remains bearish, with resistance at 414.23, 453.40 and 498.83. The 349.71 level is the next pivot-low reversal threshold, distinct from established support at 297.38, which closely aligns with the 200-week benchmark. Rising long-term averages contrast with price remaining below the 2026 yearly neutral zone, approximately 453–485. Weekly and monthly grids and the requested USAR signals are not displayed; their neutral placeholders do not establish a directional signal. The 100-week value is partially obscured. News and seasonal drivers cannot be established from this chart alone.
Chart Analysis ATS AI Generated: 2026-11-18 07:16 for Informational use only, not trading advice. Terms and Risk Disclosure Copyright © 2026. Algo Trading Systems LLC.