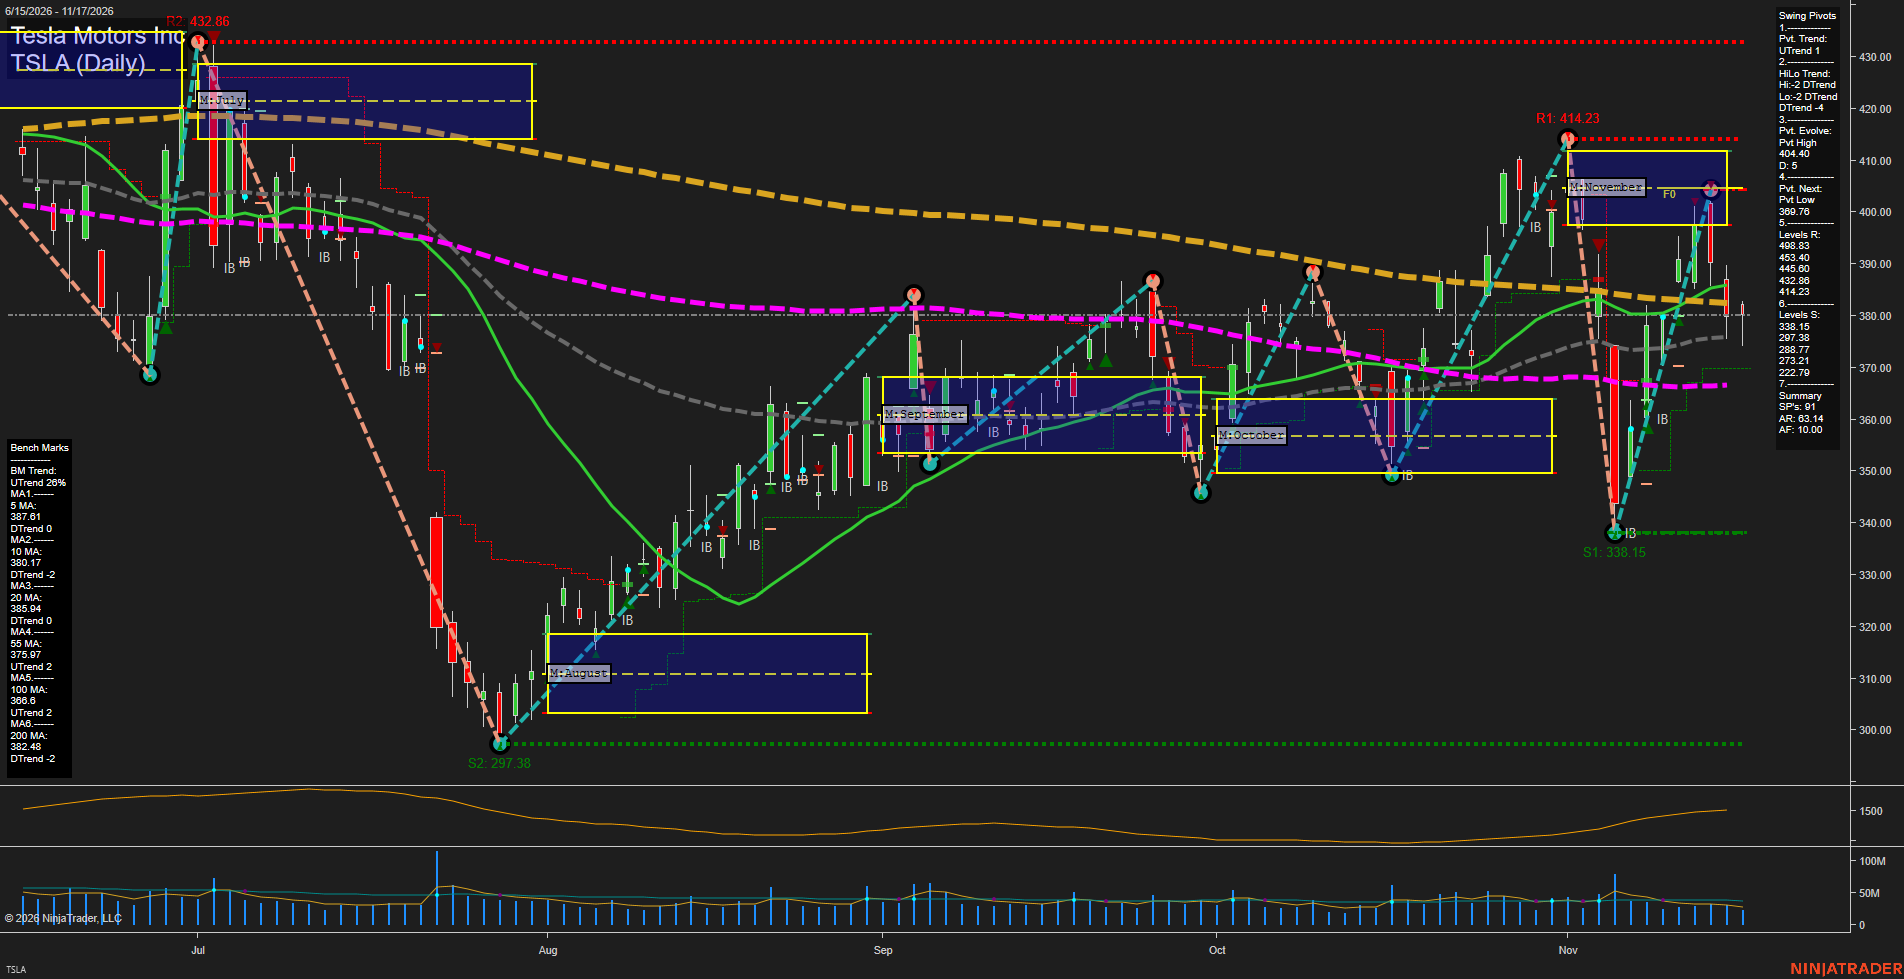
TSLA Tesla Motors Inc Daily Chart Analysis — Pre-Open: 2026-Nov-18 07:15 CT
Price Action
- Last: approximately 380.00,
- Bars: Small,
- Mom: Momentum slow.
WSFG Weekly
- Near-Term
- WSFG Current: NA%
- F0%/NTZ' Bias: Price Neutral,
- WSFG Trend: Neutral.
MSFG Month Nov
- Medium-Term
- MSFG Current: Below NTZ
- F0%/NTZ' Bias: Price Bearish,
- MSFG Trend: Bearish.
YSFG Year 2026
- Far-Term
- YSFG Current: NA%
- F0%/NTZ' Bias: Price Neutral,
- YSFG Trend: Neutral.
Swing Pivots
- (Near-Term) 1. Pvt. Trend: UTrend,
- (Medium-Term) 2. HiLo Trend: DTrend,
- 3. Pvt. Evolve: Pvt high 404.40,
- 4. Pvt. Next: Pvt low 369.76,
- 5. Levels R: 498.83, 453.40, 445.60, 432.86, 414.23,
- 6. Levels S: 338.15, 297.38, 288.77, 273.21, 222.79.
Daily Benchmarks
- (Near-Term) 5 Day: 387.61 Down Trend,
- (Near-Term) 10 Day: 380.17 Down Trend,
- (Medium-Term) 20 Day: 385.94 Down Trend,
- (Medium-Term) 55 Day: 375.97 Up Trend,
- (Far-Term) 100 Day: 366.60 Up Trend,
- (Far-Term) 200 Day: 382.48 Down Trend.
Additional Metrics
- ATR: 2032,
- VOLMA: 72571229.
Overall Rating
- Near-Term: Bearish,
- Medium-Term: Bearish,
- Far-Term: Neutral.
Key Insights Summary
From a futures swing trader’s perspective, this equity chart shows a countertrend rebound losing momentum within a medium-term downtrend. The recovery from 338.15 stalled at an evolving 404.40 pivot high, below prior resistance at 414.23. Price has subsequently fallen beneath November’s approximately 397–412 neutral zone and its 404 F0 midpoint. Smaller recent bars indicate slowing momentum, not a confirmed reversal. Price is below the falling 5-, 20- and 200-day benchmarks and approximately at the falling 10-day benchmark, while remaining above the rising 55- and 100-day averages. This mixed alignment describes a choppy transition rather than broad trend agreement. The near-term pivot uptrend remains distinct from the bearish medium-term structure; 369.76 is the displayed opposite-pivot reversal threshold, not an established support pivot. Weekly and yearly grids and named trade-signal readings are unavailable. News and seasonal influences cannot be established from the chart, and the supplied ATR value has no verified futures-point conversion.
Chart Analysis ATS AI Generated: 2026-11-18 07:16 for Informational use only, not trading advice. Terms and Risk Disclosure Copyright © 2026. Algo Trading Systems LLC.