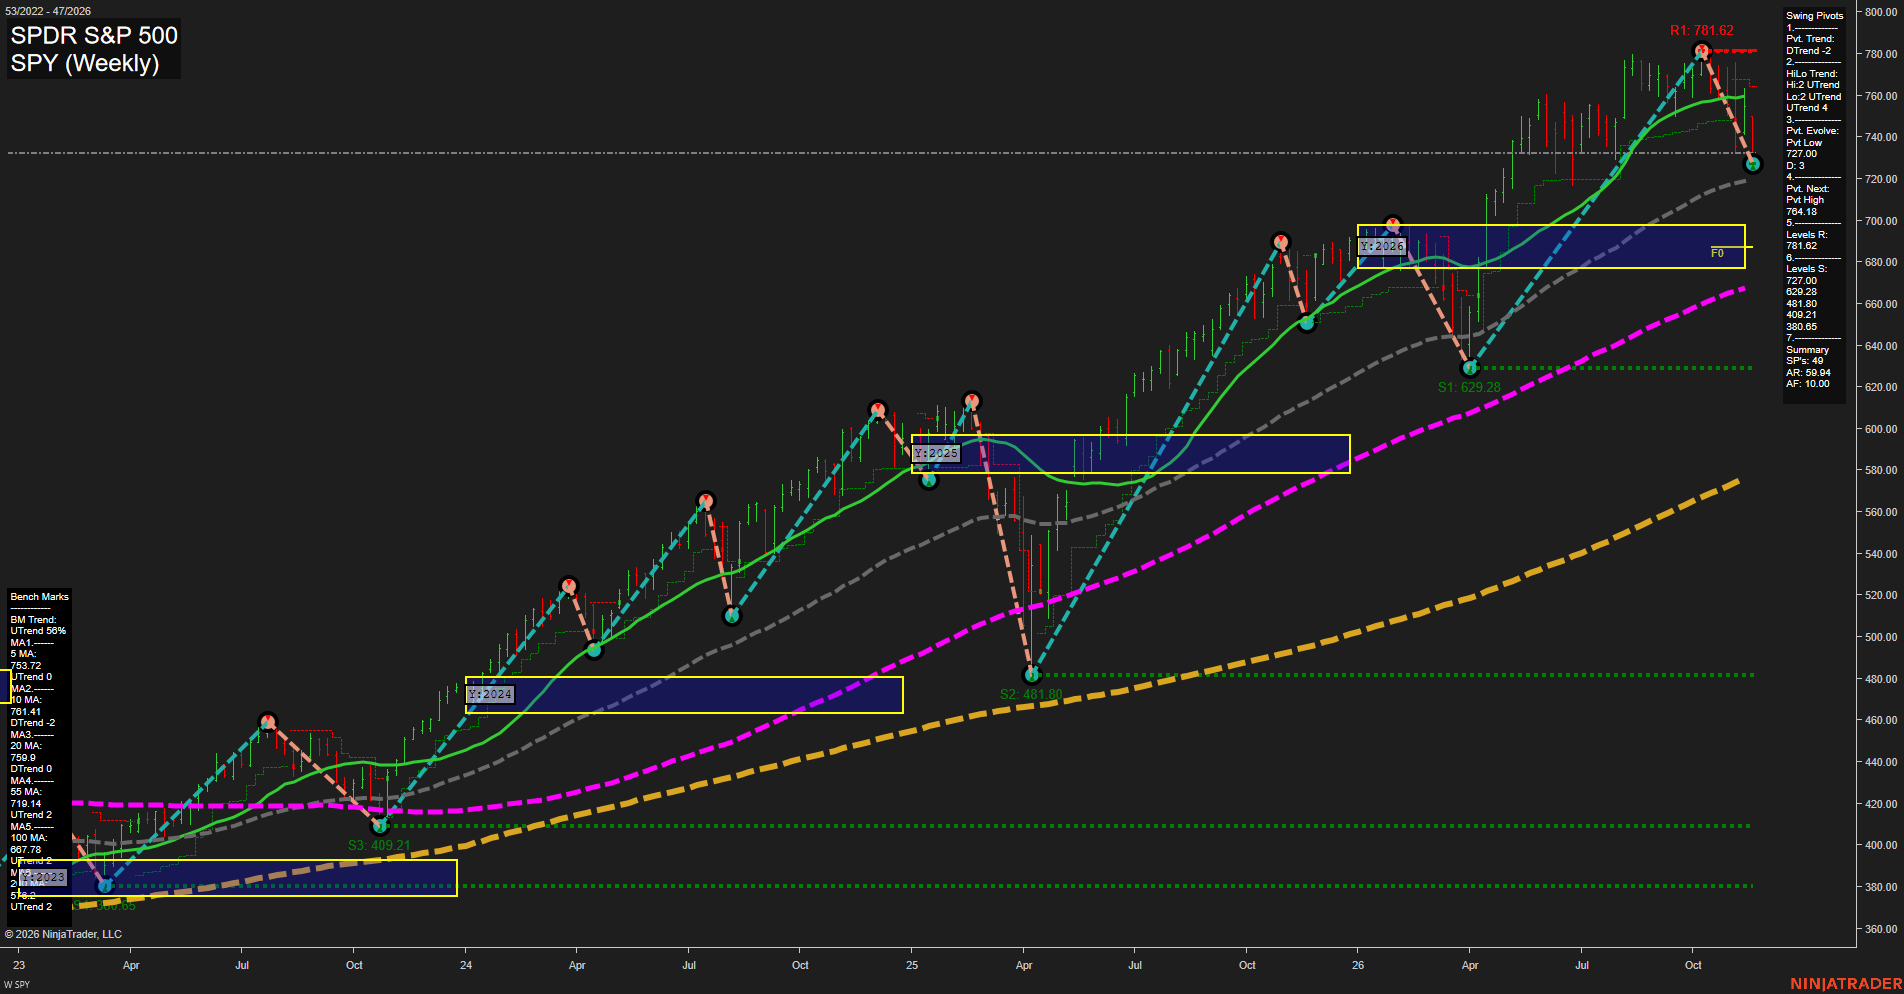
SPY SPDR S&P 500 Weekly Chart Analysis — Pre-Open: 2026-Nov-18 07:15 CT
Price Action
- Last: Approximately 732,
- Bars: Large,
- Mom: Fast downside momentum.
WSFG Weekly
- Near-Term
- WSFG Current: NA%
- F0%/NTZ' Bias: Not visible,
- WSFG Trend: Not assessable.
MSFG Month Nov
- Medium-Term
- MSFG Current: NA%
- F0%/NTZ' Bias: Not visible,
- MSFG Trend: Not assessable.
YSFG Year 2026
- Far-Term
- YSFG Current: NA%
- F0%/NTZ' Bias: Price above NTZ,
- YSFG Trend: Bullish.
Swing Pivots
- (Near-Term) 1. Pvt. Trend: DTrend,
- (Medium-Term) 2. HiLo Trend: UTrend,
- 3. Pvt. Evolve: Pvt low 727.00,
- 4. Pvt. Next: Pvt high 764.18,
- 5. Levels R: 781.62,
- 6. Levels S: 727.00, 629.28, 481.80, 409.21, 380.65.
Weekly Benchmarks
- (Near-Term) 5 Week: 753.72 Up Trend,
- (Near-Term) 10 Week: 761.41 Down Trend,
- (Medium-Term) 20 Week: 759.90 Down Trend,
- (Medium-Term) 55 Week: 719.14 Up Trend,
- (Far-Term) 100 Week: 667.78 Up Trend,
- (Far-Term) 200 Week: Approximately 574 Up Trend.
Overall Rating
- Near-Term: Bearish,
- Medium-Term: Neutral,
- Far-Term: Bullish.
Key Insights Summary
From a futures swing trader’s perspective, SPY shows a sharp countertrend downswing within a still-rising long-term structure. The decline from 781.62 to the evolving 727.00 pivot low is approximately 7%, with price below its 5-, 10- and 20-week benchmarks. The 727.00 pivot and rising 55-week benchmark at 719.14 define the immediate support area; 753.72–761.41 forms an overhead benchmark cluster. The pivot summary identifies 764.18 as the reversal threshold for the next pivot high. Medium-term conditions are mixed because the higher-high/higher-low pivot structure remains upward while the 20-week benchmark has turned down. Price remains above the yearly neutral zone, approximately 677–698, and both longer-term benchmarks continue rising. Weekly/monthly grids and named recent trade signals are not displayed, so they cannot confirm these ratings. These are SPY reference levels, not directly transferable ES or MES futures prices; the chart alone does not establish news or seasonal drivers.
Chart Analysis ATS AI Generated: 2026-11-18 07:15 for Informational use only, not trading advice. Terms and Risk Disclosure Copyright © 2026. Algo Trading Systems LLC.