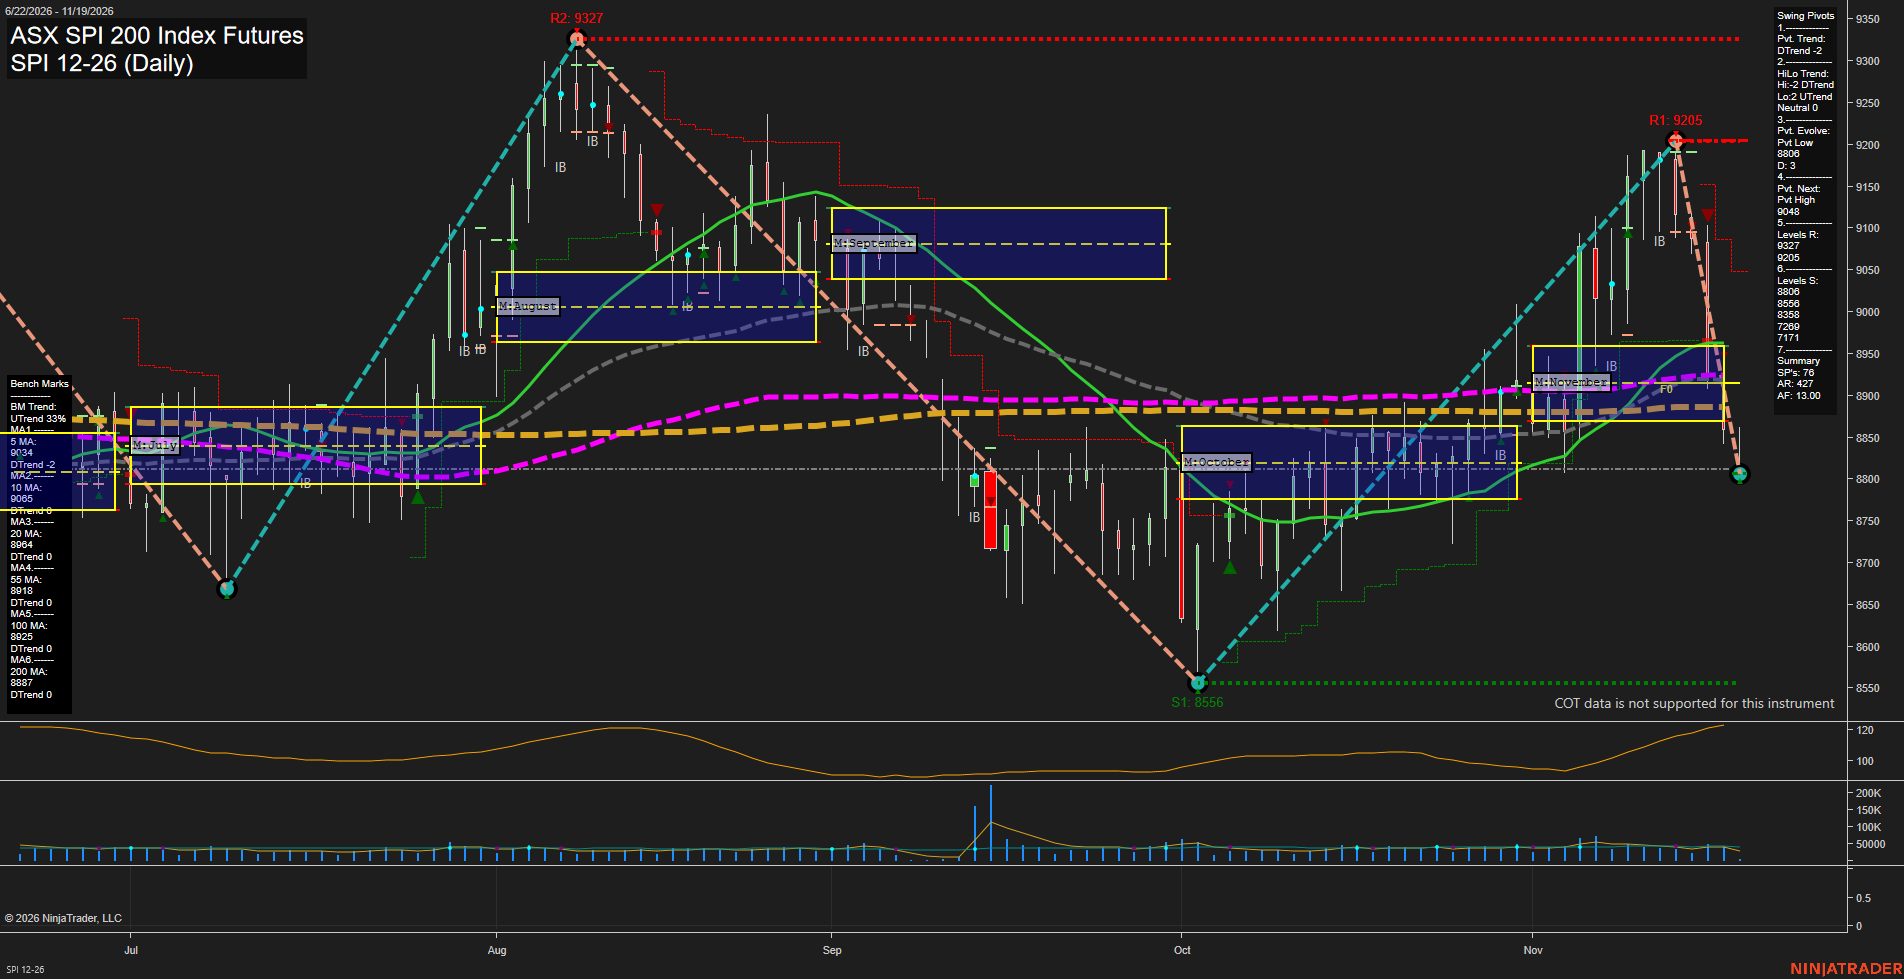
SPI ASX SPI 200 Index Futures Daily Chart Analysis — Pre-Open: 2026-Nov-18 07:14 CT
Price Action
- Last: 8806 approximately,
- Bars: Large,
- Mom: Momentum fast.
WSFG Weekly
- Near-Term
- WSFG Current: NA%
- F0%/NTZ' Bias: Price Neutral,
- WSFG Trend: Neutral.
MSFG Month Nov
- Medium-Term
- MSFG Current: NA%
- F0%/NTZ' Bias: Price Neutral,
- MSFG Trend: Neutral.
YSFG Year 2026
- Far-Term
- YSFG Current: NA%
- F0%/NTZ' Bias: Price Neutral,
- YSFG Trend: Neutral.
Swing Pivots
- (Near-Term) 1. Pvt. Trend: DTrend,
- (Medium-Term) 2. HiLo Trend: Neutral,
- 3. Pvt. Evolve: Pvt low 8806,
- 4. Pvt. Next: Pvt high 9048,
- 5. Levels R: 9327, 9205,
- 6. Levels S: 8806, 8556, 8358, 7269, 7171.
Daily Benchmarks
- (Near-Term) 5 Day: 9034 Down Trend,
- (Near-Term) 10 Day: 9065 Down Trend,
- (Medium-Term) 20 Day: 8964 Down Trend,
- (Medium-Term) 55 Day: 8918 Down Trend,
- (Far-Term) 100 Day: 8925 Down Trend,
- (Far-Term) 200 Day: 8887 Down Trend.
Additional Metrics
Overall Rating
- Near-Term: Bearish,
- Medium-Term: Bearish,
- Far-Term: Bearish.
Key Insights Summary
The rebound from 8556 stalled at 9205, below the earlier 9327 swing high, and reversed sharply toward evolving support at 8806. Large declining bars and price below all six benchmarks indicate bearish momentum across time horizons. Medium-term pivot structure remains mixed, with lower highs but a higher low; the benchmark alignment nevertheless makes the medium-term balance bearish. The November monthly grid visibly sits above current price, indicating downside displacement despite the neutral grid placeholders above. The 8887–8964 benchmark cluster now represents overhead technical resistance, while 8556 remains the next established support below 8806. Longer-term bearish ratings describe current price and benchmark conditions rather than a confirmed major structural breakdown. Weekly and yearly grids, named signal-system readings, and news catalysts cannot be verified from this image.
Chart Analysis ATS AI Generated: 2026-11-18 07:14 for Informational use only, not trading advice. Terms and Risk Disclosure Copyright © 2026. Algo Trading Systems LLC.