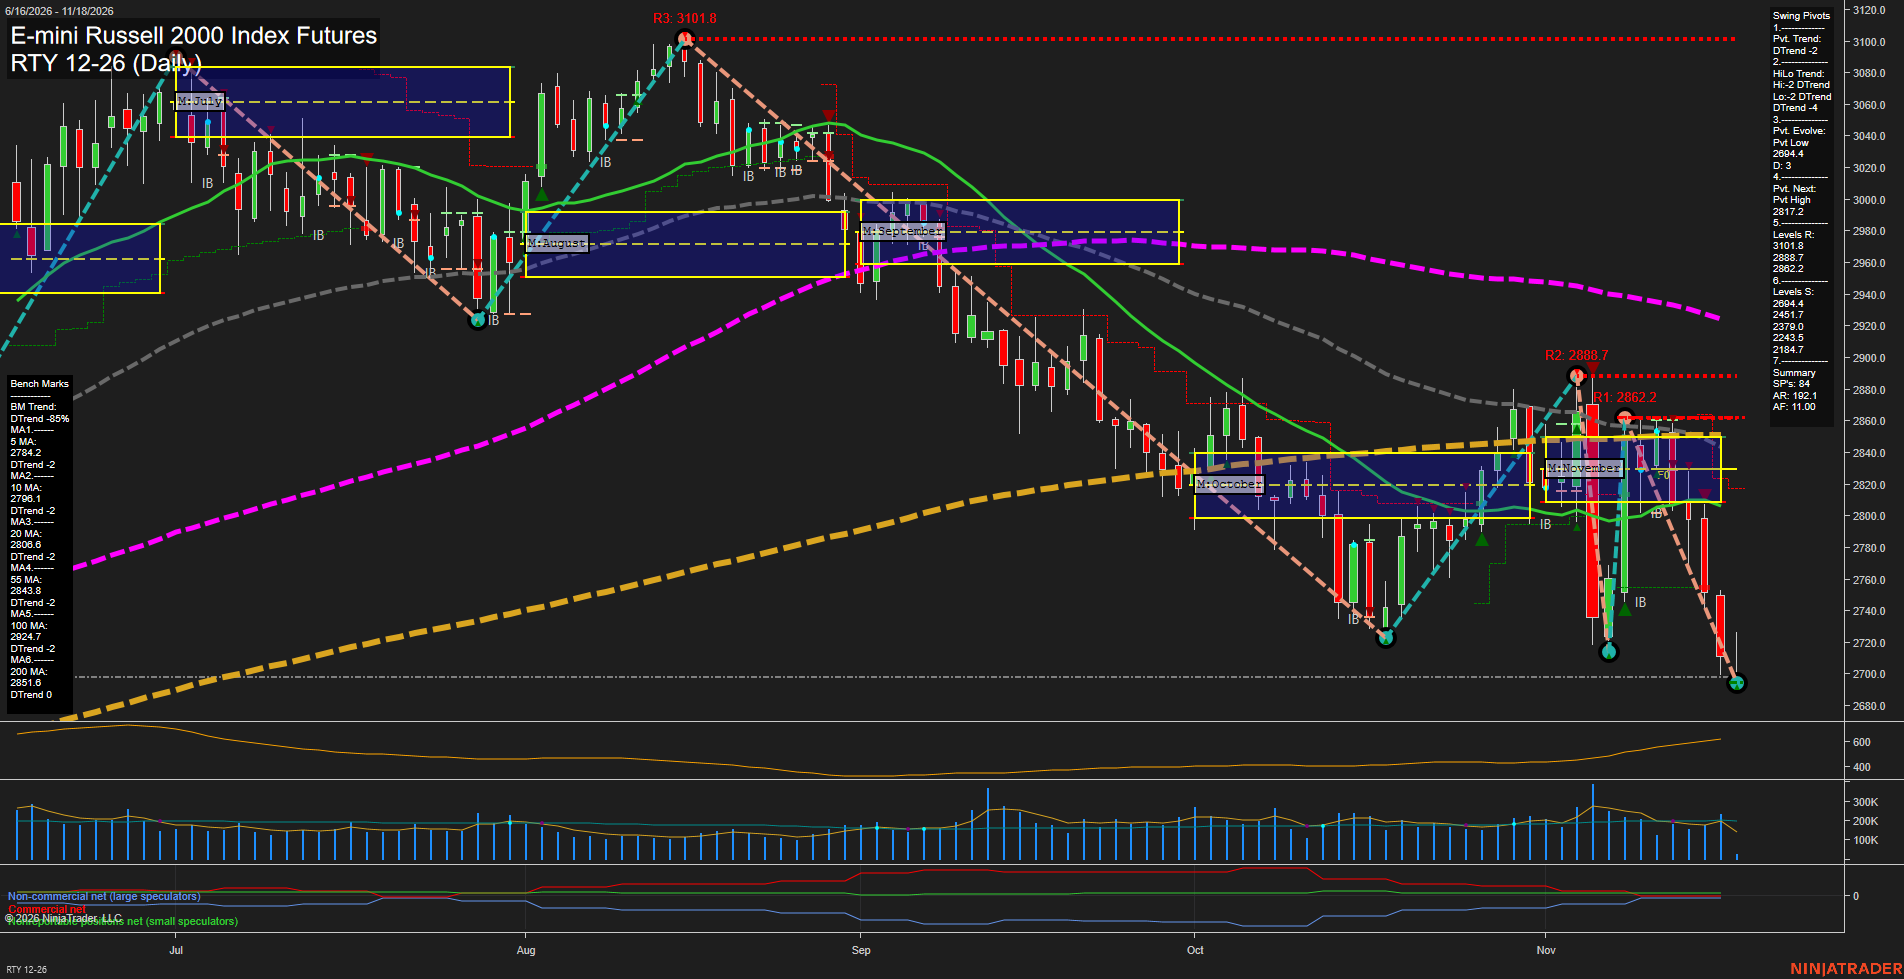
RTY E-mini Russell 2000 Index Futures Daily Chart Analysis — Pre-Open: 2026-Nov-18 07:13 CT
Price Action
- Last: Approximately 2699,
- Bars: Large,
- Mom: Momentum fast.
WSFG Weekly
- Near-Term
- WSFG Current: -90%
- F0%/NTZ' Bias: Price Below,
- WSFG Trend: Down.
MSFG Month Nov
- Medium-Term
- MSFG Current: -90%
- F0%/NTZ' Bias: Price Below,
- MSFG Trend: Down.
YSFG Year 2026
- Far-Term
- YSFG Current: 15%
- F0%/NTZ' Bias: Price Above,
- YSFG Trend: Up.
Swing Pivots
- (Near-Term) 1. Pvt. Trend: DTrend,
- (Medium-Term) 2. HiLo Trend: DTrend,
- 3. Pvt. Evolve: Pvt low 2694.4,
- 4. Pvt. Next: Pvt high 2817.2,
- 5. Levels R: 3101.8, 2888.7, 2862.2,
- 6. Levels S: 2694.4, 2451.7, 2379.0, 2243.5, 2184.7.
Daily Benchmarks
- (Near-Term) 5 Day: 2784.2 Down Trend,
- (Near-Term) 10 Day: 2796.1 Down Trend,
- (Medium-Term) 20 Day: 2806.8 Down Trend,
- (Medium-Term) 55 Day: 2843.8 Down Trend,
- (Far-Term) 100 Day: 2924.7 Down Trend,
- (Far-Term) 200 Day: 2851.6 Down Trend.
Additional Metrics
Recent Trade Signals
- 16 Nov 2026: Short RTY 12-26 @ 2773.2 Signals.USAR-WSFG
- 13 Nov 2026: Short RTY 12-26 @ 2809.6 Signals.USAR-MSFG
- 12 Nov 2026: Short RTY 12-26 @ 2821.1 Signals.USAR.TR120
Overall Rating
- Near-Term: Bearish,
- Medium-Term: Bearish,
- Far-Term: Bearish.
Key Insights Summary
From a futures swing-trading perspective, the November rebound has resolved into bearish continuation. Successively lower resistance pivots at 2888.7 and 2862.2, followed by an evolving low at 2694.4, reinforce the lower-high/lower-low structure. Large recent downside candles and price beneath every benchmark indicate strong selling momentum rather than orderly consolidation. Weekly and monthly grids agree with the three recent short signals; the next opposite-pivot reversal reference is 2817.2. The nearby 2694.4 support is being tested, while the remaining listed historical supports are substantially lower and are not implied downside targets. The positive yearly grid remains a longer-horizon counterpoint, but declining long-term benchmarks leave the overall far-term balance bearish. News catalysts and seasonal effects cannot be established from this chart alone.
Chart Analysis ATS AI Generated: 2026-11-18 07:13 for Informational use only, not trading advice. Terms and Risk Disclosure Copyright © 2026. Algo Trading Systems LLC.