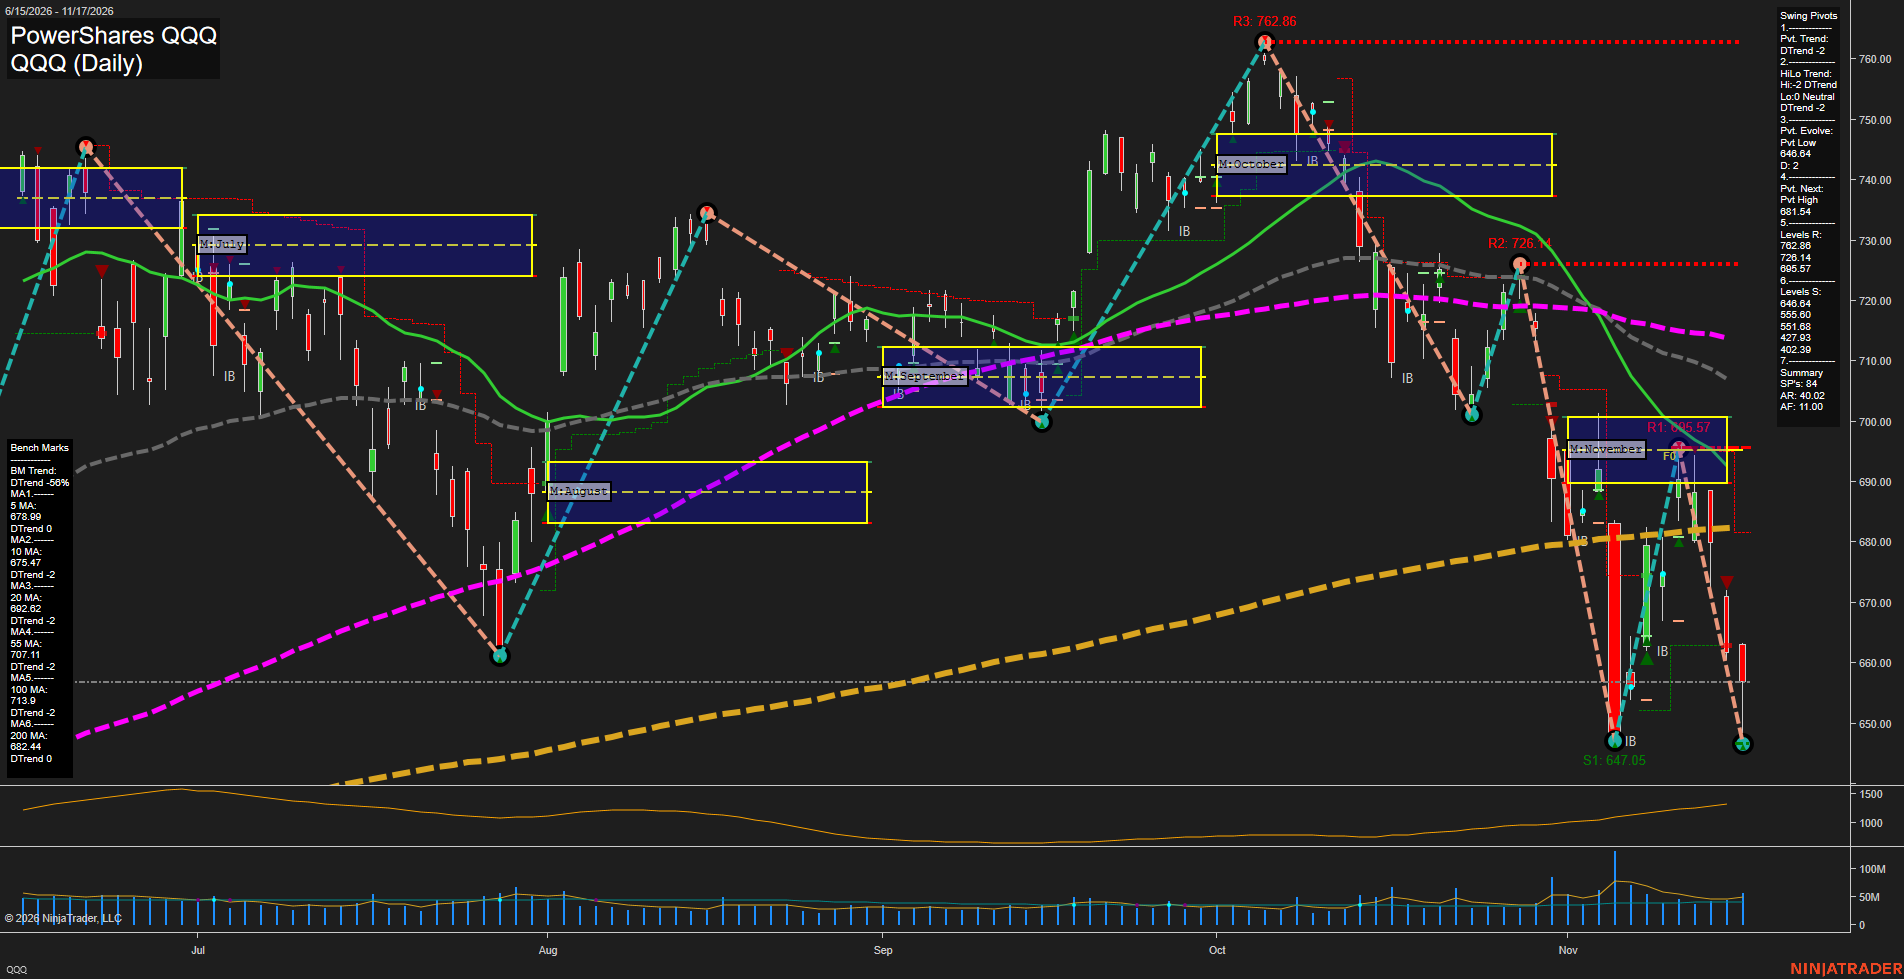
QQQ PowerShares QQQ Daily Chart Analysis — Pre-Open: 2026-Nov-18 07:12 CT
Price Action
- Last: Approximately 657.00,
- Bars: Large,
- Mom: Momentum fast.
WSFG Weekly
- Near-Term
- WSFG Current: NA%
- F0%/NTZ' Bias: Price Neutral,
- WSFG Trend: Neutral.
MSFG Month Nov
- Medium-Term
- MSFG Current: NA%
- F0%/NTZ' Bias: Price Bearish,
- MSFG Trend: Bearish.
YSFG Year 2026
- Far-Term
- YSFG Current: NA%
- F0%/NTZ' Bias: Price Neutral,
- YSFG Trend: Neutral.
Swing Pivots
- (Near-Term) 1. Pvt. Trend: DTrend,
- (Medium-Term) 2. HiLo Trend: DTrend,
- 3. Pvt. Evolve: Pvt low 646.64,
- 4. Pvt. Next: Pvt high 681.54,
- 5. Levels R: 762.86, 726.14, 695.57,
- 6. Levels S: 646.64, 555.60, 551.68, 427.93, 402.39.
Daily Benchmarks
- (Near-Term) 5 Day: 678.99 Down Trend,
- (Near-Term) 10 Day: 675.47 Down Trend,
- (Medium-Term) 20 Day: 692.82 Down Trend,
- (Medium-Term) 55 Day: 707.11 Down Trend,
- (Far-Term) 100 Day: 713.90 Down Trend,
- (Far-Term) 200 Day: 682.44 Down Trend.
Additional Metrics
- ATR: 733,
- VOLMA: 32709273.
Overall Rating
- Near-Term: Bearish,
- Medium-Term: Bearish,
- Far-Term: Bearish.
Key Insights Summary
From a futures swing trader’s perspective, QQQ reflects bearish Nasdaq exposure across multiple time horizons; these are ETF levels, not futures contract prices. The rebound from approximately 647 to 695.57 failed near November’s monthly grid, followed by a fast decline that marginally undercut the prior swing low. Price remains beneath all six benchmarks and below the monthly neutral zone near 690–701, reinforcing the lower-high structure and bearish trend continuation. The evolving 646.64 low is the immediate structural reference; 681.54 is the summary’s next opposite-pivot reversal threshold, not a confirmed swing high. The 200-day average is still visually rising despite its summary downside classification, distinguishing deteriorating price positioning from the longer-term average’s slope. Weekly and yearly grids and named strategy signals are not visible, so their direction cannot be independently confirmed; neutral grid entries indicate unavailable evidence. News and seasonal explanations are not established by this chart.
Chart Analysis ATS AI Generated: 2026-11-18 07:12 for Informational use only, not trading advice. Terms and Risk Disclosure Copyright © 2026. Algo Trading Systems LLC.