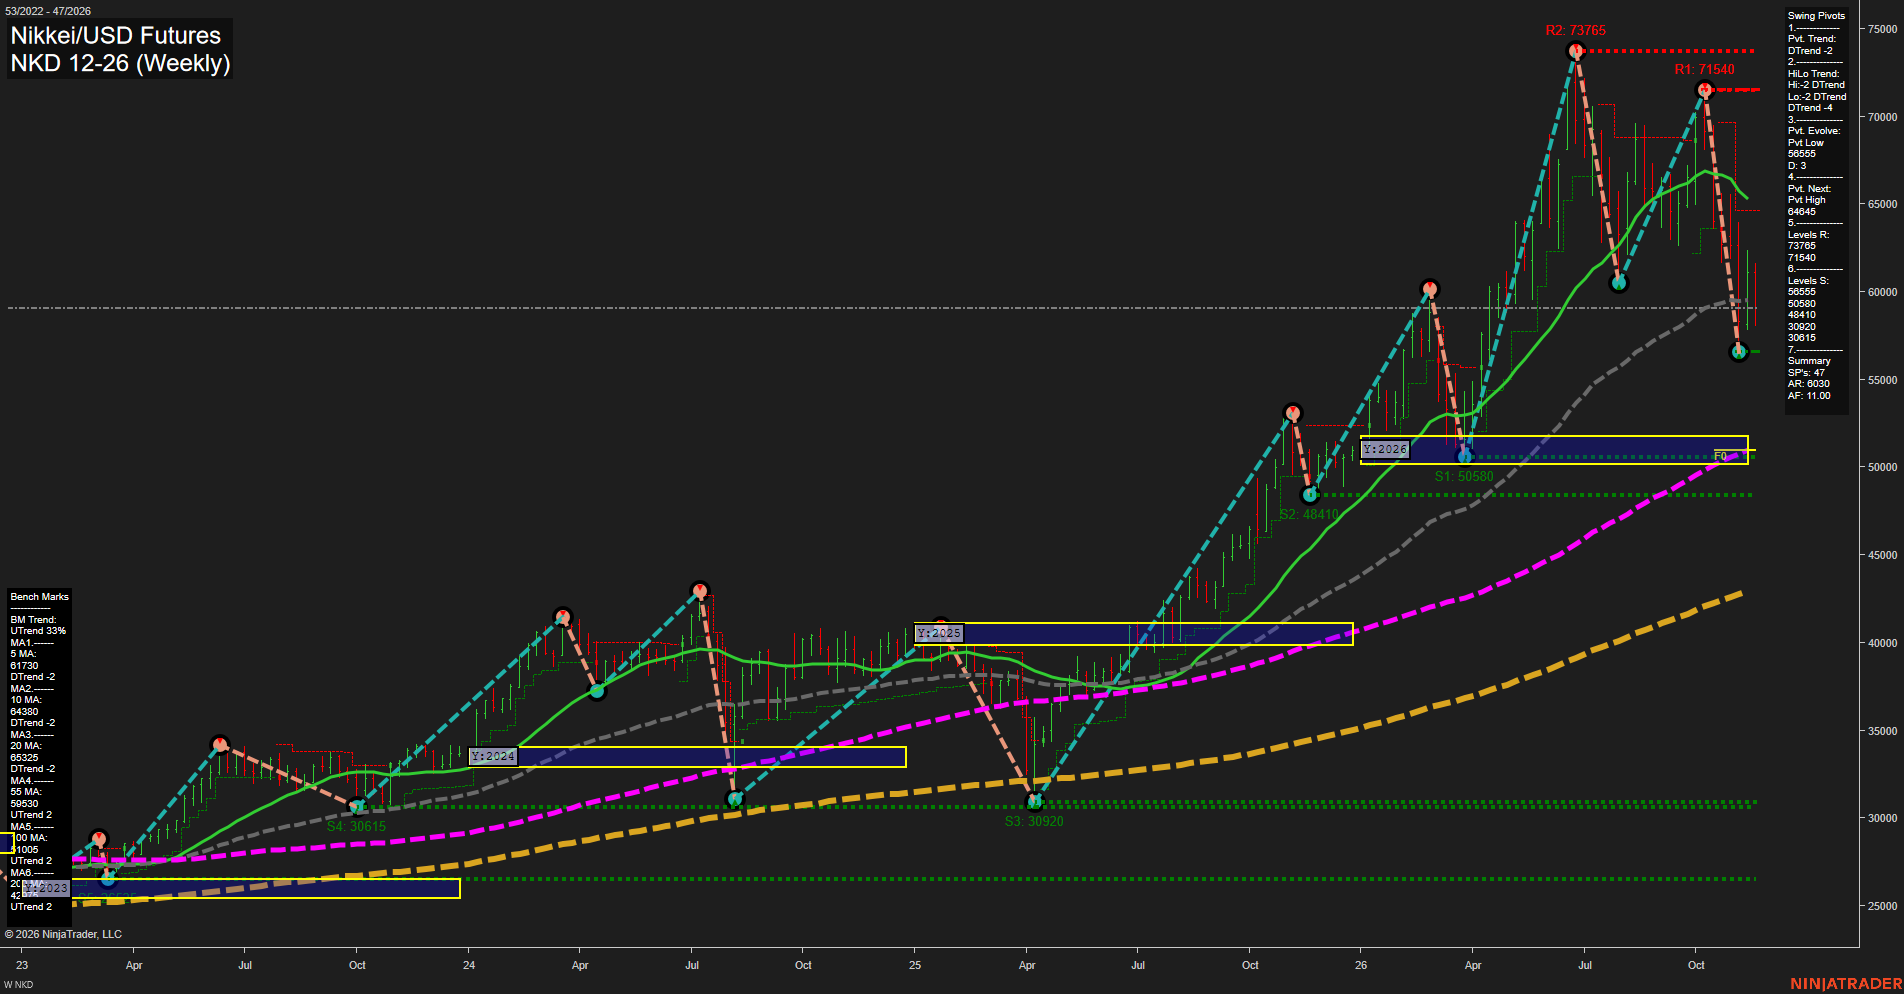
NKD Nikkei/USD Futures Weekly Chart Analysis — Pre-Open: 2026-Nov-18 07:10 CT
Price Action
- Last: Approximately 59,100,
- Bars: Large,
- Mom: Fast downside momentum with a developing rebound.
WSFG Weekly
- Near-Term
- WSFG Current: -41%
- F0%/NTZ' Bias: Price Below,
- WSFG Trend: Down.
MSFG Month Nov
- Medium-Term
- MSFG Current: -46%
- F0%/NTZ' Bias: Price Below,
- MSFG Trend: Down.
YSFG Year 2026
- Far-Term
- YSFG Current: 101%
- F0%/NTZ' Bias: Price Above,
- YSFG Trend: Up.
Swing Pivots
- (Near-Term) 1. Pvt. Trend: DTrend,
- (Medium-Term) 2. HiLo Trend: DTrend,
- 3. Pvt. Evolve: Pvt low 56,555,
- 4. Pvt. Next: Pvt high 64,645,
- 5. Levels R: 73,765, 71,540,
- 6. Levels S: 56,555, 50,580, 48,410, 30,920, 30,615.
Weekly Benchmarks
- (Near-Term) 5 Week: 61,730 Down Trend,
- (Near-Term) 10 Week: 64,380 Down Trend,
- (Medium-Term) 20 Week: 65,325 Down Trend,
- (Medium-Term) 55 Week: 59,530 Up Trend,
- (Far-Term) 100 Week: 51,005 Up Trend,
- (Far-Term) 200 Week: Approximately 42,900 Up Trend.
Overall Rating
- Near-Term: Bearish,
- Medium-Term: Bearish,
- Far-Term: Bullish.
Key Insights Summary
From a futures swing-trading perspective, the chart shows a sharp corrective downswing within a still-rising long-term structure. The lower high at 71,540 versus 73,765 and subsequent low at 56,555 establish a bearish pivot sequence. Price is below the declining 5-, 10- and 20-week benchmarks and slightly below the rising 55-week benchmark, reinforcing near- and medium-term weakness. The rebound from 56,555 has not reversed the displayed pivot downtrend; the summary identifies 64,645 as the next opposite-pivot reversal threshold. Longer-term structure remains constructive, with price above the rising 100- and 200-week benchmarks and the yearly neutral zone around 50,000–52,000. Large weekly ranges indicate elevated volatility rather than orderly consolidation. Recent USAR signal readings are not visible, so these ratings reflect the supplied session-grid readings, visible pivots and benchmarks; news and seasonal effects cannot be established from this chart alone.
Chart Analysis ATS AI Generated: 2026-11-18 07:11 for Informational use only, not trading advice. Terms and Risk Disclosure Copyright © 2026. Algo Trading Systems LLC.