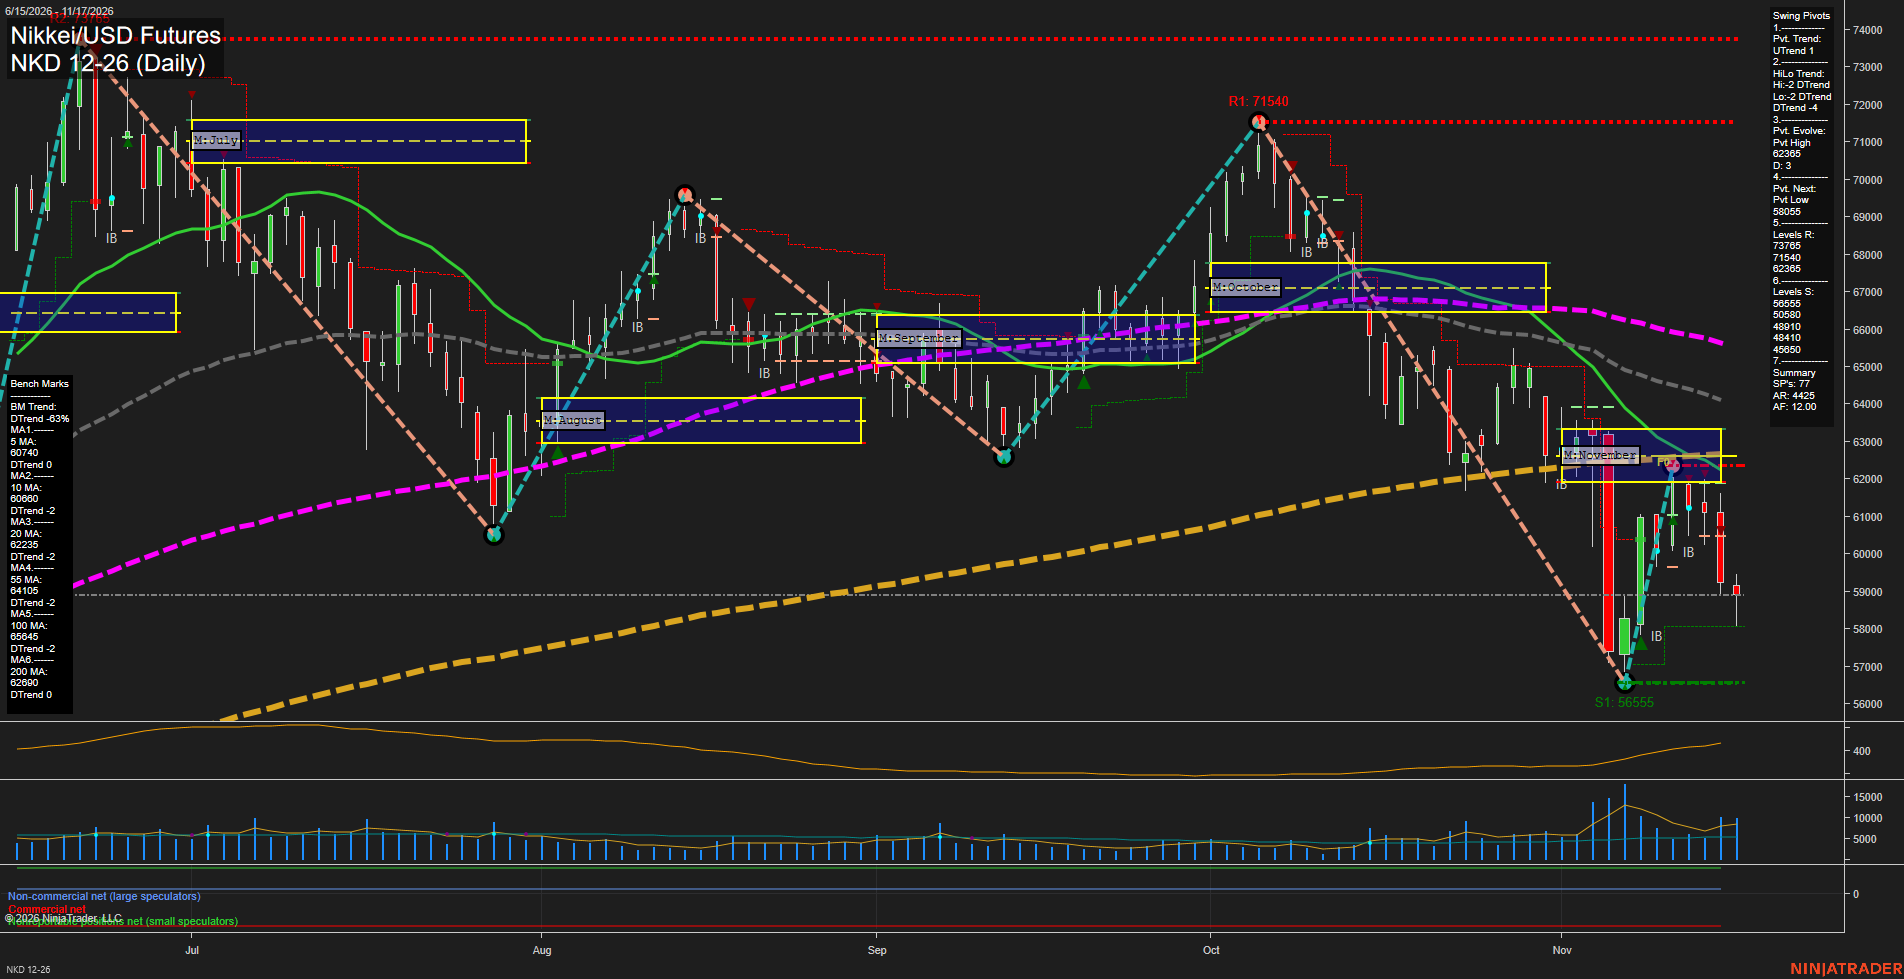
NKD Nikkei/USD Futures Daily Chart Analysis — Pre-Open: 2026-Nov-18 07:10 CT
Price Action
- Last: Approximately 58,900,
- Bars: Medium,
- Mom: Momentum fast.
WSFG Weekly
- Near-Term
- WSFG Current: -41%
- F0%/NTZ' Bias: Price Below,
- WSFG Trend: Down.
MSFG Month Nov
- Medium-Term
- MSFG Current: -46%
- F0%/NTZ' Bias: Price Below,
- MSFG Trend: Down.
YSFG Year 2026
- Far-Term
- YSFG Current: 101%
- F0%/NTZ' Bias: Price Above,
- YSFG Trend: Up.
Swing Pivots
- (Near-Term) 1. Pvt. Trend: UTrend,
- (Medium-Term) 2. HiLo Trend: DTrend,
- 3. Pvt. Evolve: Pvt high 62,365,
- 4. Pvt. Next: Pvt low 58,055,
- 5. Levels R: 73,765, 71,540, 62,365,
- 6. Levels S: 56,555, 50,580, 48,910, 48,410, 45,650.
Daily Benchmarks
- (Near-Term) 5 Day: 60,740 Down Trend,
- (Near-Term) 10 Day: 60,660 Down Trend,
- (Medium-Term) 20 Day: 62,235 Down Trend,
- (Medium-Term) 55 Day: 64,105 Down Trend,
- (Far-Term) 100 Day: 65,645 Down Trend,
- (Far-Term) 200 Day: 62,690 Down Trend.
Additional Metrics
Overall Rating
- Near-Term: Bearish,
- Medium-Term: Bearish,
- Far-Term: Bearish.
Key Insights Summary
From a futures swing-trading perspective, the rebound from 56,555 to 62,365 appears to be a countertrend rally within the broader decline from 71,540. Renewed selling below November’s NTZ and every benchmark moving average reinforces bearish control. The near-term pivot classification remains UTrend, but price has retreated toward the 58,055 opposite-pivot reversal threshold; the medium-term lower-high/lower-low structure remains down. Resistance is concentrated around 60,660–60,740 and 62,235–62,690, while 56,555 is the nearest listed swing support. Recent wide-range selling and elevated volume indicate an active correction rather than quiet consolidation. The positive yearly grid contrasts with bearish benchmark trends, showing deterioration within a still-positive annual framework. Named USAR signal readings and news catalysts are not identifiable in the supplied chart.
Chart Analysis ATS AI Generated: 2026-11-18 07:10 for Informational use only, not trading advice. Terms and Risk Disclosure Copyright © 2026. Algo Trading Systems LLC.