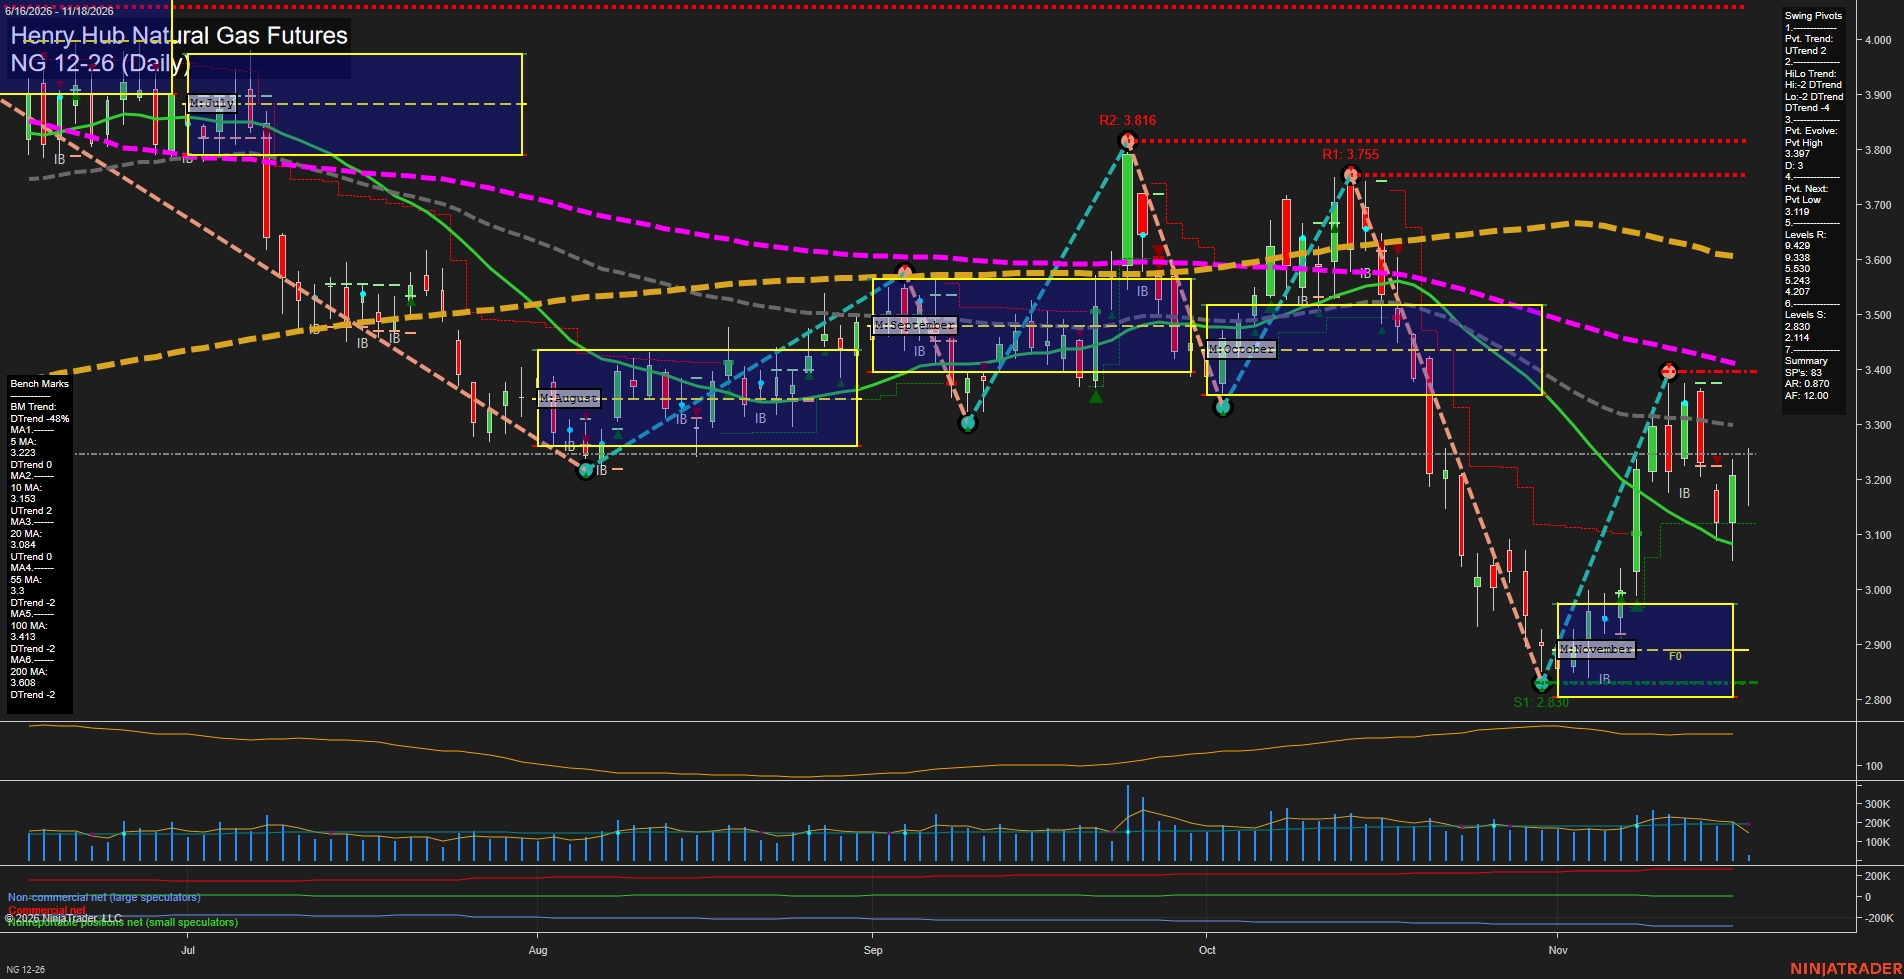
NG Henry Hub Natural Gas Futures Daily Chart Analysis — Pre-Open: 2026-Nov-18 07:10 CT
Price Action
- Last: Approximately 3.245,
- Bars: Medium,
- Mom: Momentum average.
WSFG Weekly
- Near-Term
- WSFG Current: 18%
- F0%/NTZ' Bias: Price Above,
- WSFG Trend: Up.
MSFG Month Nov
- Medium-Term
- MSFG Current: 67%
- F0%/NTZ' Bias: Price Above,
- MSFG Trend: Up.
YSFG Year 2026
- Far-Term
- YSFG Current: 7%
- F0%/NTZ' Bias: Price Above,
- YSFG Trend: Up.
Swing Pivots
- (Near-Term) 1. Pvt. Trend: UTrend,
- (Medium-Term) 2. HiLo Trend: DTrend,
- 3. Pvt. Evolve: Pvt high 3.397,
- 4. Pvt. Next: Pvt low 3.119,
- 5. Levels R: 9.429, 9.338, 5.530, 5.243, 4.207,
- 6. Levels S: 2.830, 2.114.
Daily Benchmarks
- (Near-Term) 5 Day: 3.223 Down Trend,
- (Near-Term) 10 Day: 3.153 Up Trend,
- (Medium-Term) 20 Day: 3.084 Up Trend,
- (Medium-Term) 55 Day: 3.300 Down Trend,
- (Far-Term) 100 Day: 3.413 Down Trend,
- (Far-Term) 200 Day: 3.608 Down Trend.
Additional Metrics
Recent Trade Signals
- 17 Nov 2026: Short NG 12-26 @ 3.105 Signals.USAR-WSFG
- 16 Nov 2026: Short NG 12-26 @ 3.166 Signals.USAR.TR120
Overall Rating
- Near-Term: Neutral,
- Medium-Term: Neutral,
- Far-Term: Bearish.
Key Insights Summary
The November rebound from 2.830 remains a countertrend recovery within a broader declining structure. Price is above the weekly and monthly grids and the 5-, 10- and 20-day benchmarks, but below the declining 55-, 100- and 200-day averages. The near-term pivot uptrend contrasts with the medium-term lower-high/lower-low trend; rejection around 3.397 and subsequent alternating candles indicate consolidation rather than an uninterrupted rally. The next opposite-pivot threshold is 3.119. Visible local swing resistance at 3.397, 3.755 and 3.816 is separate from the more distant resistance levels listed in the pivot summary. Recent short signals conflict with the positive grid readings, leaving shorter horizons mixed while the far-term technical balance remains bearish. Winter heating season provides seasonal context, but the chart alone cannot establish weather, storage or news catalysts.
Chart Analysis ATS AI Generated: 2026-11-18 07:10 for Informational use only, not trading advice. Terms and Risk Disclosure Copyright © 2026. Algo Trading Systems LLC.