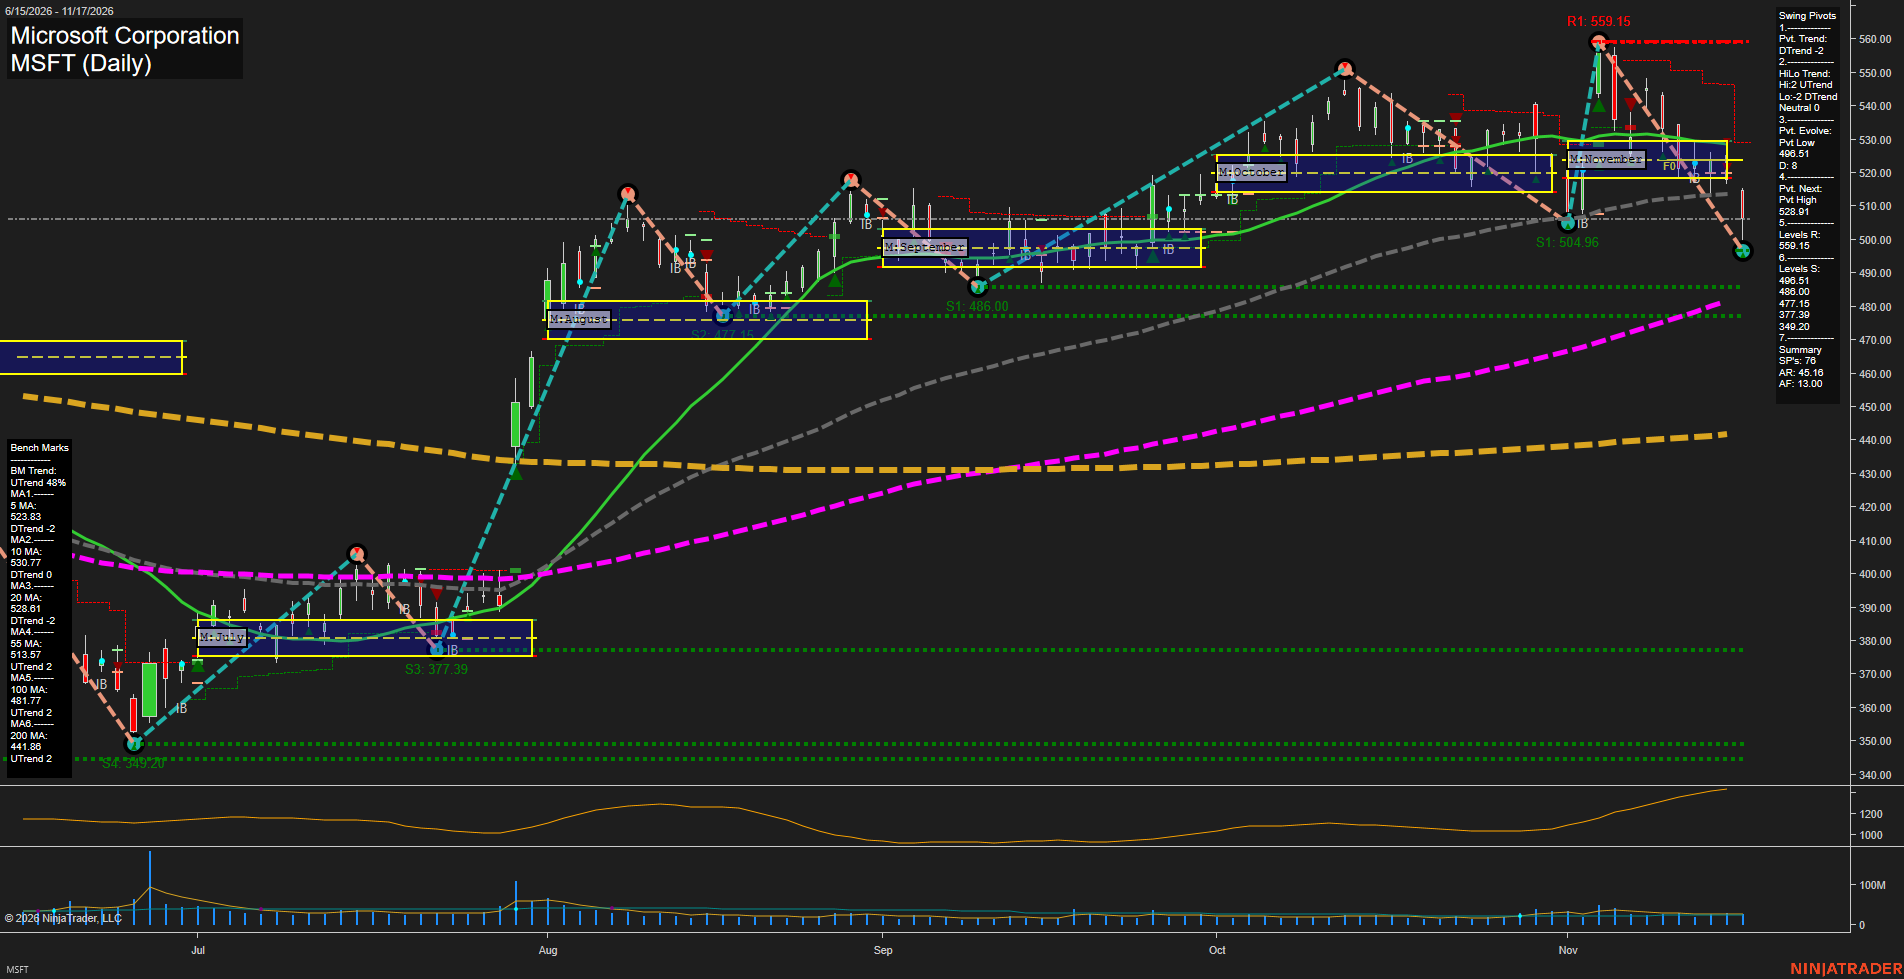
MSFT Microsoft Corporation Daily Chart Analysis — Pre-Open: 2026-Nov-18 07:09 CT
Price Action
- Last: Approximately 506.00,
- Bars: Large,
- Mom: Momentum fast, bearish.
WSFG Weekly
- Near-Term
- WSFG Current: NA%
- F0%/NTZ' Bias: Price Neutral,
- WSFG Trend: Neutral.
MSFG Month Nov
- Medium-Term
- MSFG Current: NA%
- F0%/NTZ' Bias: Price below F0% and NTZ,
- MSFG Trend: Bearish.
YSFG Year 2026
- Far-Term
- YSFG Current: NA%
- F0%/NTZ' Bias: Price Neutral,
- YSFG Trend: Neutral.
Swing Pivots
- (Near-Term) 1. Pvt. Trend: DTrend,
- (Medium-Term) 2. HiLo Trend: Neutral,
- 3. Pvt. Evolve: Pvt low 496.51,
- 4. Pvt. Next: Pvt high 528.91,
- 5. Levels R: 559.15,
- 6. Levels S: 496.51, 486.00, 477.15, 377.39, 349.20.
Daily Benchmarks
- (Near-Term) 5 Day: 523.83 Down Trend,
- (Near-Term) 10 Day: 530.77 Down Trend,
- (Medium-Term) 20 Day: 528.61 Down Trend,
- (Medium-Term) 55 Day: 513.57 Up Trend,
- (Far-Term) 100 Day: 481.77 Up Trend,
- (Far-Term) 200 Day: 441.86 Up Trend.
Additional Metrics
- ATR: 791,
- VOLMA: 26357793.
Overall Rating
- Near-Term: Bearish,
- Medium-Term: Bearish,
- Far-Term: Bullish.
Key Insights Summary
From a futures swing trader’s perspective, MSFT shows a fast corrective downswing within a still-rising longer-term structure. Rejection from 559.15 has carried price beneath the November value zone and the 5-, 10-, 20- and 55-day benchmarks. The evolving 496.51 low also undercuts the prior 504.96 pivot, indicating near-term structural deterioration. Medium-term pivots remain mixed, with higher highs but lower lows. The 513.57 benchmark and approximately 518–530 November consolidation define overhead resistance, while 496.51, 486.00 and 477.15 mark successive support references. Rising ATR indicates expanding daily ranges rather than quiet consolidation. Price remains above rising 100- and 200-day benchmarks, preserving the far-term bullish backdrop. Weekly and yearly grids and named trade-signal readings are not visible; their neutral entries reflect unavailable confirmation. The supplied ATR value is retained, although the plotted indicator appears higher. No news or seasonal catalyst can be established from this chart.
Chart Analysis ATS AI Generated: 2026-11-18 07:09 for Informational use only, not trading advice. Terms and Risk Disclosure Copyright © 2026. Algo Trading Systems LLC.