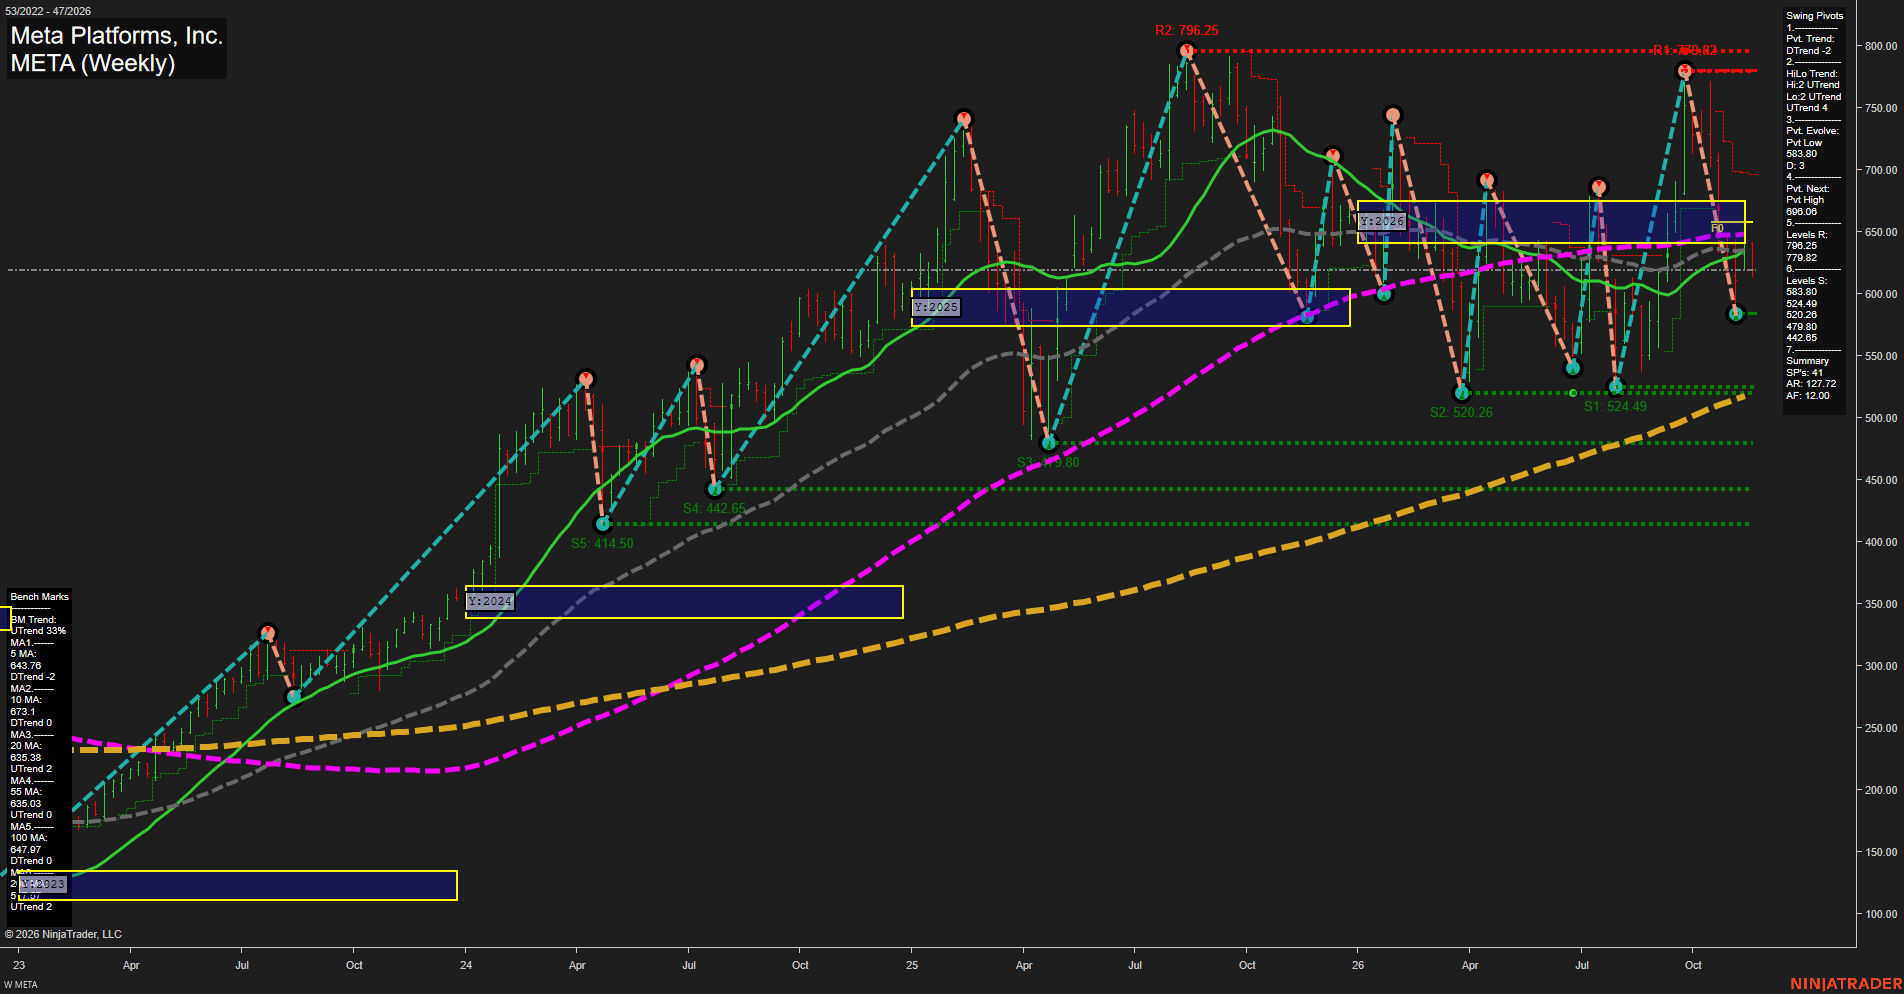
META Meta Platforms; Inc. Weekly Chart Analysis — Pre-Open: 2026-Nov-18 07:09 CT
Price Action
- Last: Approximately 620,
- Bars: Large,
- Mom: Momentum fast on the downswing, with an initial rebound.
WSFG Weekly
- Near-Term
- WSFG Current: NA%
- F0%/NTZ' Bias: Price Neutral,
- WSFG Trend: Neutral.
MSFG Month Nov
- Medium-Term
- MSFG Current: NA%
- F0%/NTZ' Bias: Price Neutral,
- MSFG Trend: Neutral.
YSFG Year 2026
- Far-Term
- YSFG Current: NA%
- F0%/NTZ' Bias: Price below NTZ,
- YSFG Trend: Bearish.
Swing Pivots
- (Near-Term) 1. Pvt. Trend: DTrend,
- (Medium-Term) 2. HiLo Trend: UTrend,
- 3. Pvt. Evolve: Pvt low 583.80,
- 4. Pvt. Next: Pvt high 696.06,
- 5. Levels R: 796.25, 779.82,
- 6. Levels S: 583.80, 524.49, 520.26, 479.80, 442.65.
Weekly Benchmarks
- (Near-Term) 5 Week: 643.76 Down Trend,
- (Near-Term) 10 Week: 673.10 Down Trend,
- (Medium-Term) 20 Week: 635.38 Up Trend,
- (Medium-Term) 55 Week: 635.03 Up Trend,
- (Far-Term) 100 Week: 647.97 Down Trend,
- (Far-Term) 200 Week: Approximately 520 Up Trend.
Overall Rating
- Near-Term: Bearish,
- Medium-Term: Bullish,
- Far-Term: Bearish.
Key Insights Summary
From a futures swing-trading perspective, META shows a fast corrective downswing within a broader rising structure, rather than a clean trend continuation. The decline from 779.82 to the evolving 583.80 pivot low has produced a rebound, but price remains below all benchmarks through 100 weeks. The clustered 20- and 55-week averages near 635, followed by 643.76–647.97, define substantial overhead congestion. Medium-term bullishness rests on the summary’s higher-high/higher-low trend and rising 20- and 55-week benchmarks; near-term momentum remains bearish. Price below the 2026 NTZ and a declining 100-week benchmark weaken the far-term picture, although the rising 200-week average preserves a longer-duration bullish underpinning. Repeated sharp reversals characterize a volatile, overlapping range rather than orderly directional movement. Weekly and monthly grids and the requested recent trade-signal summaries are not visible, so their neutral entries are placeholders rather than confirmed readings. No news or seasonal catalyst can be established from this chart.
Chart Analysis ATS AI Generated: 2026-11-18 07:09 for Informational use only, not trading advice. Terms and Risk Disclosure Copyright © 2026. Algo Trading Systems LLC.