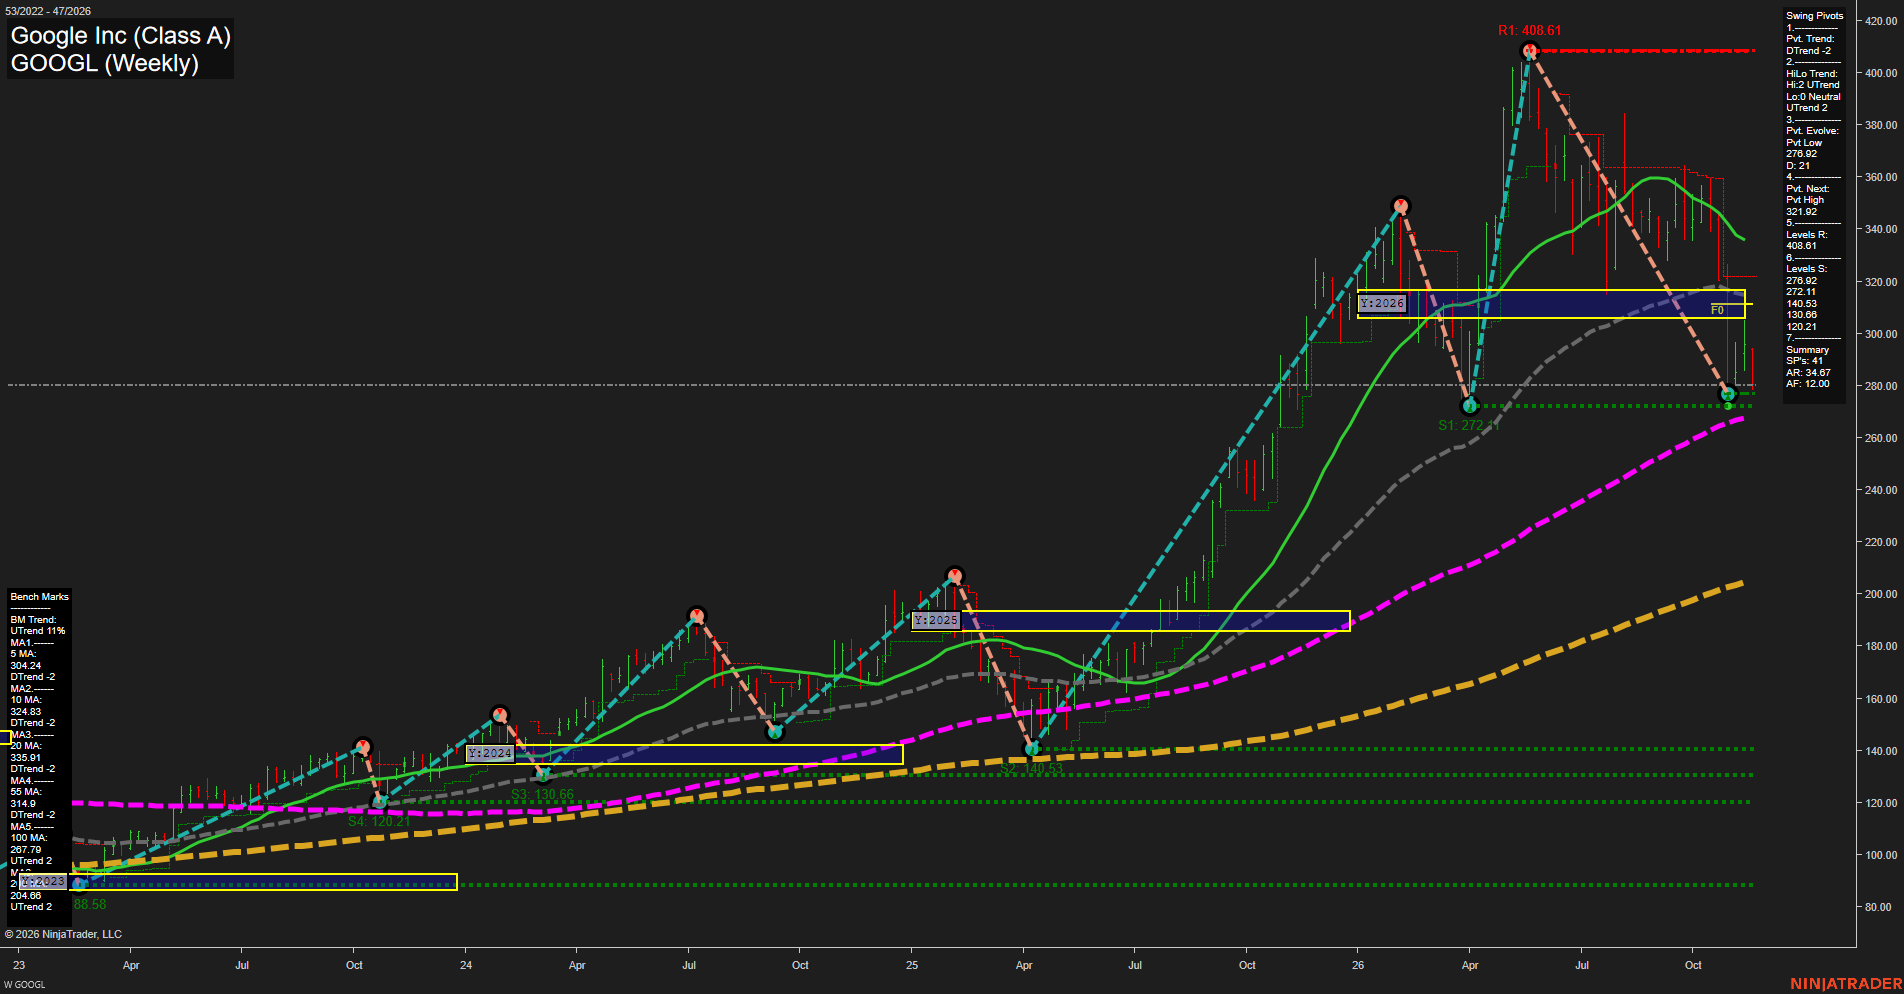
GOOGL Google Inc (Class A) Weekly Chart Analysis — Pre-Open: 2026-Nov-18 07:08 CT
Price Action
- Last: Approximately 280,
- Bars: Large,
- Mom: Momentum fast to the downside.
WSFG Weekly
- Near-Term
- WSFG Current: NA%
- F0%/NTZ' Bias: Price Neutral,
- WSFG Trend: Neutral.
MSFG Month Nov
- Medium-Term
- MSFG Current: NA%
- F0%/NTZ' Bias: Price Neutral,
- MSFG Trend: Neutral.
YSFG Year 2026
- Far-Term
- YSFG Current: NA%
- F0%/NTZ' Bias: Price below F0% and NTZ,
- YSFG Trend: Bearish.
Swing Pivots
- (Near-Term) 1. Pvt. Trend: DTrend,
- (Medium-Term) 2. HiLo Trend: UTrend,
- 3. Pvt. Evolve: Pvt low 276.92,
- 4. Pvt. Next: Pvt high 321.92,
- 5. Levels R: 408.61,
- 6. Levels S: 276.92, 272.11, 140.53, 130.66, 120.21.
Weekly Benchmarks
- (Near-Term) 5 Week: 304.24 Down Trend,
- (Near-Term) 10 Week: 324.83 Down Trend,
- (Medium-Term) 20 Week: 335.91 Down Trend,
- (Medium-Term) 55 Week: 314.9 Down Trend,
- (Far-Term) 100 Week: 267.79 Up Trend,
- (Far-Term) 200 Week: 204.08 Up Trend.
Overall Rating
- Near-Term: Bearish,
- Medium-Term: Bearish,
- Far-Term: Bullish.
Key Insights Summary
From a futures swing trader’s perspective, the dominant feature is a fast corrective downswing within a still-rising long-term structure. Price has retraced roughly 31% from 408.61 and sits below all four shorter weekly benchmarks and the yearly neutral zone near 306–317. The evolving 276.92 low remains slightly above 272.11, preserving the medium-term higher-low structure despite bearish momentum. This support cluster sits just above the rising 100-week benchmark at 267.79. The 304–336 region contains substantial overhead benchmark and yearly-grid resistance; 321.92 is the summary’s next pivot reversal threshold. The far-term bullish rating reflects rising 100- and 200-week benchmarks, offset by the bearish yearly-grid position. Weekly and monthly grids and the requested recent signal series are not visible, so their neutral entries represent unavailable confirmation rather than established balance. News and seasonal drivers cannot be verified from this chart.
Chart Analysis ATS AI Generated: 2026-11-18 07:08 for Informational use only, not trading advice. Terms and Risk Disclosure Copyright © 2026. Algo Trading Systems LLC.