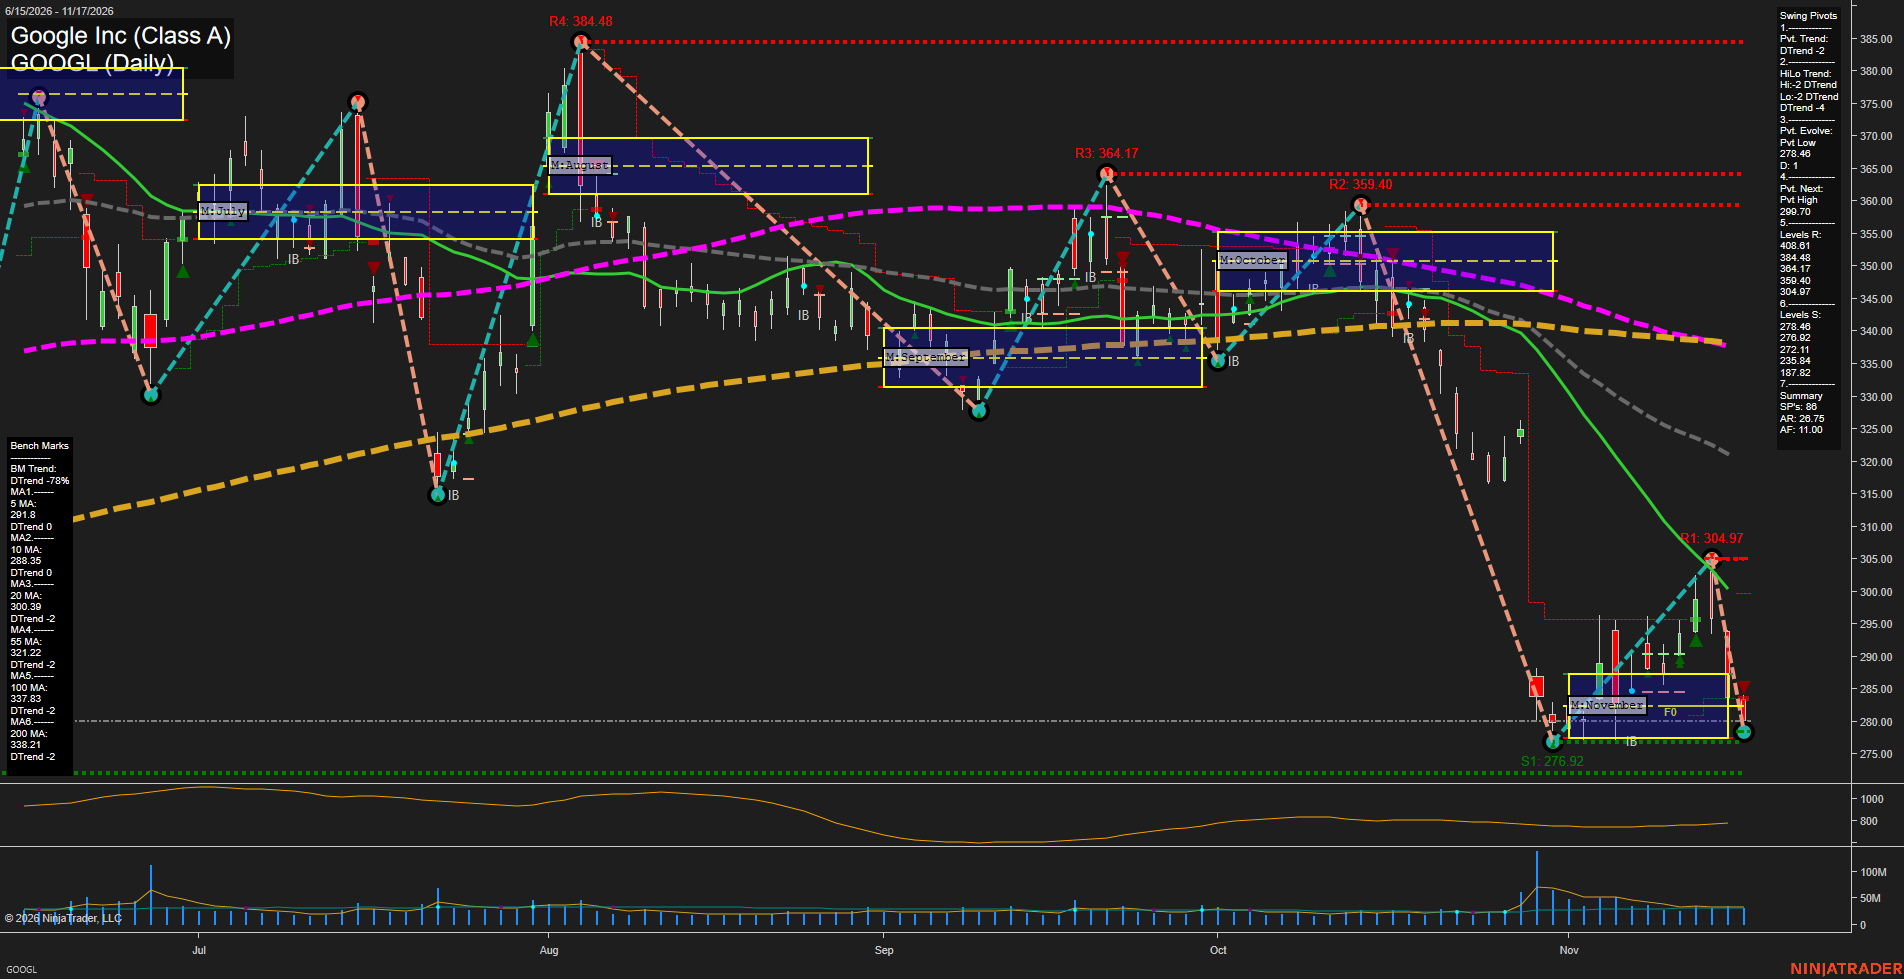
GOOGL Google Inc (Class A) Daily Chart Analysis — Pre-Open: 2026-Nov-18 07:08 CT
Price Action
- Last: approximately 280.00,
- Bars: Large,
- Mom: Momentum fast.
WSFG Weekly
- Near-Term
- WSFG Current: NA%
- F0%/NTZ' Bias: Price Neutral,
- WSFG Trend: Neutral.
MSFG Month Nov
- Medium-Term
- MSFG Current: NA%
- F0%/NTZ' Bias: Price Neutral,
- MSFG Trend: Neutral.
YSFG Year 2026
- Far-Term
- YSFG Current: NA%
- F0%/NTZ' Bias: Price Neutral,
- YSFG Trend: Neutral.
Swing Pivots
- (Near-Term) 1. Pvt. Trend: DTrend,
- (Medium-Term) 2. HiLo Trend: DTrend,
- 3. Pvt. Evolve: Pvt low 278.46,
- 4. Pvt. Next: Pvt high 299.70,
- 5. Levels R: 408.61, 384.48, 364.17, 359.40, 304.97,
- 6. Levels S: 278.46, 276.92, 272.11, 235.84, 187.82.
Daily Benchmarks
- (Near-Term) 5 Day: 291.80 Down Trend,
- (Near-Term) 10 Day: 288.35 Down Trend,
- (Medium-Term) 20 Day: 300.39 Down Trend,
- (Medium-Term) 55 Day: 321.22 Down Trend,
- (Far-Term) 100 Day: 337.83 Down Trend,
- (Far-Term) 200 Day: 338.21 Down Trend.
Additional Metrics
- ATR: 420,
- VOLMA: 25379774.
Overall Rating
- Near-Term: Bearish,
- Medium-Term: Bearish,
- Far-Term: Bearish.
Key Insights Summary
From a futures swing trader’s perspective, this equity chart shows bearish alignment across time horizons rather than a confirmed reversal. The rebound from 276.92 to 304.97 formed a lower high, followed by a fast decline back toward the prior low. Price is below every benchmark, while both pivot trends remain down. The November neutral zone contains current price near its lower boundary, indicating local consolidation within a broader downtrend. Support is concentrated at 278.46–276.92, followed by 272.11; the next pivot reversal threshold is 299.70, with established resistance at 304.97. The recent rebound currently reads as countertrend, and the support retest has not confirmed a double bottom. Weekly and yearly grids and named trade-signal readings are not available for verification; their neutral entries are placeholders, not independent evidence. News and seasonal effects cannot be established from this chart, which depicts GOOGL shares rather than a futures contract.
Chart Analysis ATS AI Generated: 2026-11-18 07:08 for Informational use only, not trading advice. Terms and Risk Disclosure Copyright © 2026. Algo Trading Systems LLC.