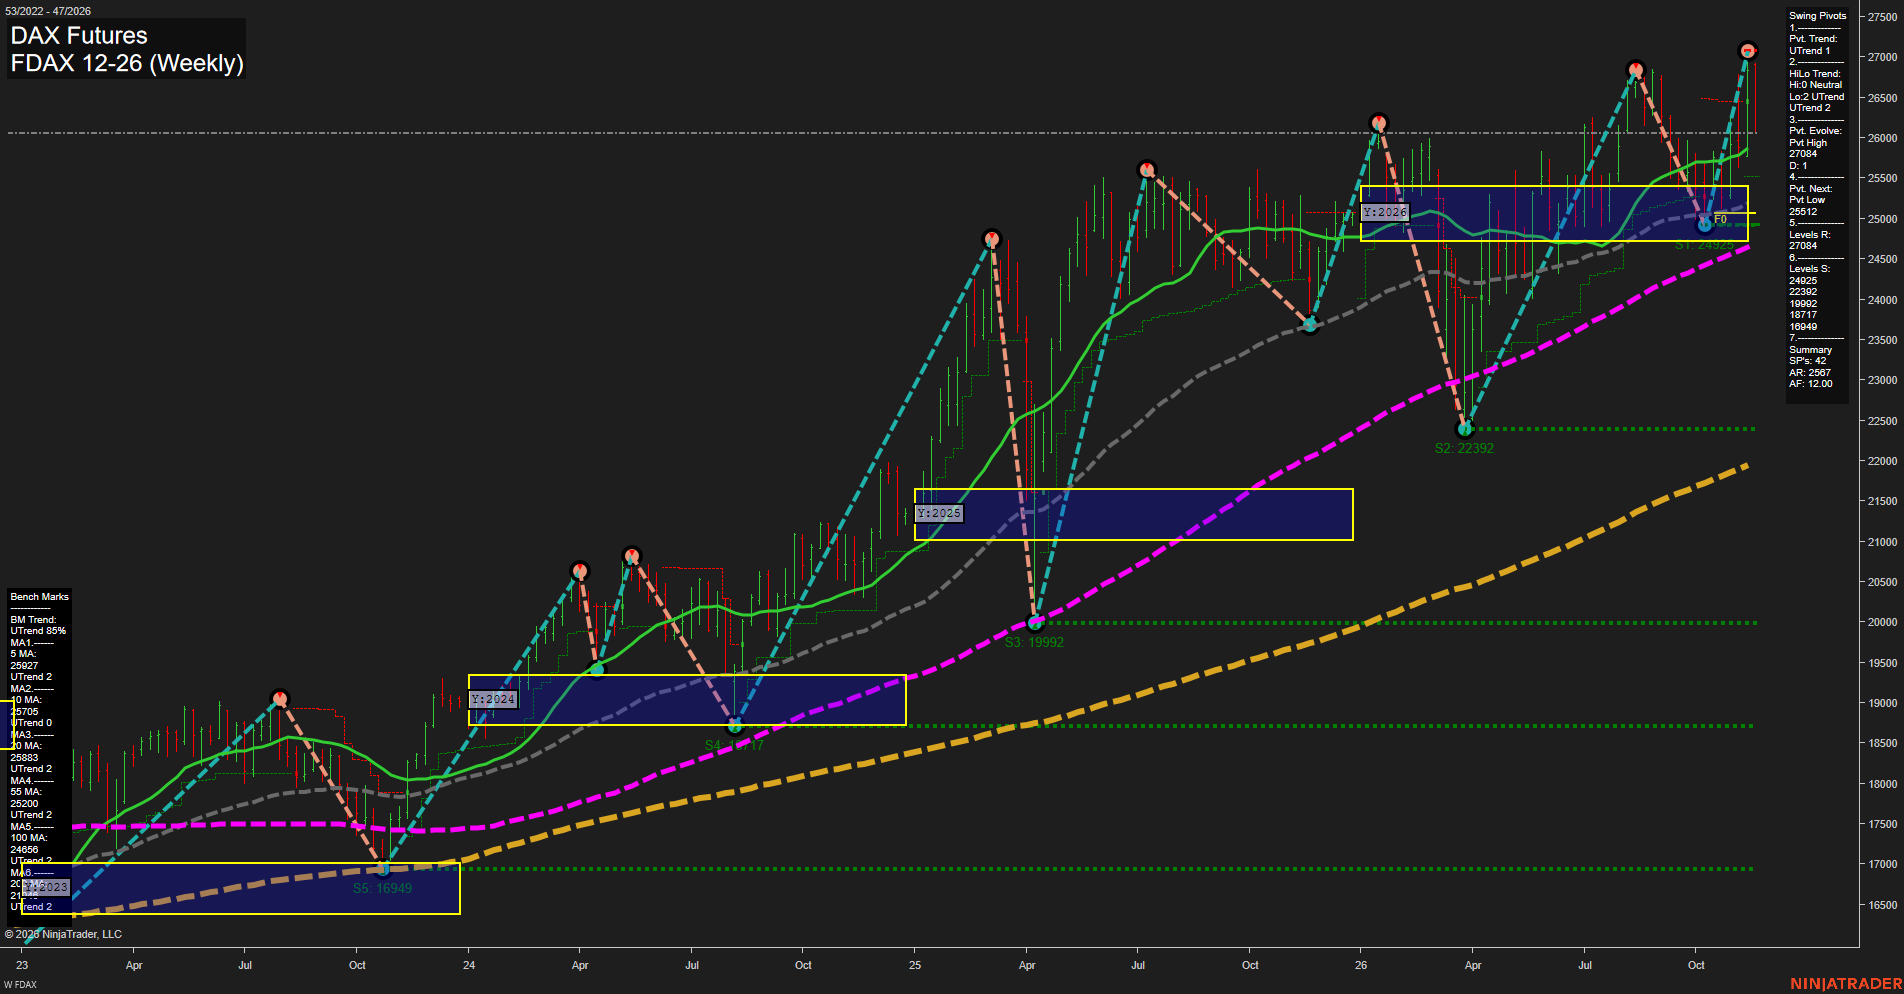
FDAX DAX Futures Weekly Chart Analysis — Pre-Open: 2026-Nov-18 07:06 CT
Price Action
- Last: approximately 26060,
- Bars: Large,
- Mom: Momentum fast, with a sharp downside reversal from the recent high.
WSFG Weekly
- Near-Term
- WSFG Current: -85%
- F0%/NTZ' Bias: Price Below,
- WSFG Trend: Down.
MSFG Month Nov
- Medium-Term
- MSFG Current: 6%
- F0%/NTZ' Bias: Price Above,
- MSFG Trend: Up.
YSFG Year 2026
- Far-Term
- YSFG Current: 28%
- F0%/NTZ' Bias: Price Above,
- YSFG Trend: Up.
Swing Pivots
- (Near-Term) 1. Pvt. Trend: UTrend,
- (Medium-Term) 2. HiLo Trend: UTrend,
- 3. Pvt. Evolve: Pvt high 27084,
- 4. Pvt. Next: Pvt low 25512,
- 5. Levels R: 27084,
- 6. Levels S: 24925, 22392, 19992, 18717, 16949.
Weekly Benchmarks
- (Near-Term) 5 Week: 25927 Up Trend,
- (Near-Term) 10 Week: 25705 Up Trend,
- (Medium-Term) 20 Week: 25883 Up Trend,
- (Medium-Term) 55 Week: 25200 Up Trend,
- (Far-Term) 100 Week: 24656 Up Trend,
- (Far-Term) 200 Week: approximately 21950 Up Trend.
Recent Trade Signals
- 16 Nov 2026: Short FDAX 12-26 @ 26681 Signals.USAR.TR120
- 16 Nov 2026: Short FDAX 12-26 @ 26774 Signals.USAR-WSFG
Overall Rating
- Near-Term: Bearish,
- Medium-Term: Bullish,
- Far-Term: Bullish.
Key Insights Summary
From a futures swing trader’s perspective, the chart shows a near-term bearish countertrend move within an established weekly advance. Rejection from the evolving 27084 pivot high and two recent short signals align with the declining weekly grid, although the pivot trend and both near-term benchmarks remain upward. Price remains above all six weekly benchmarks, with the 5-, 10- and 20-week averages clustered around 25705–25927. The 25512 pivot-reversal threshold separates the current evolving high from confirmation of a new downward pivot leg; 24925 is the highest established swing support. Higher swing lows, rising longer-term averages and positive monthly and yearly grids preserve the broader bullish structure. Large weekly ranges reflect volatile, two-way price discovery rather than a smooth trend continuation. The image alone does not establish a news or seasonal catalyst.
Chart Analysis ATS AI Generated: 2026-11-18 07:06 for Informational use only, not trading advice. Terms and Risk Disclosure Copyright © 2026. Algo Trading Systems LLC.