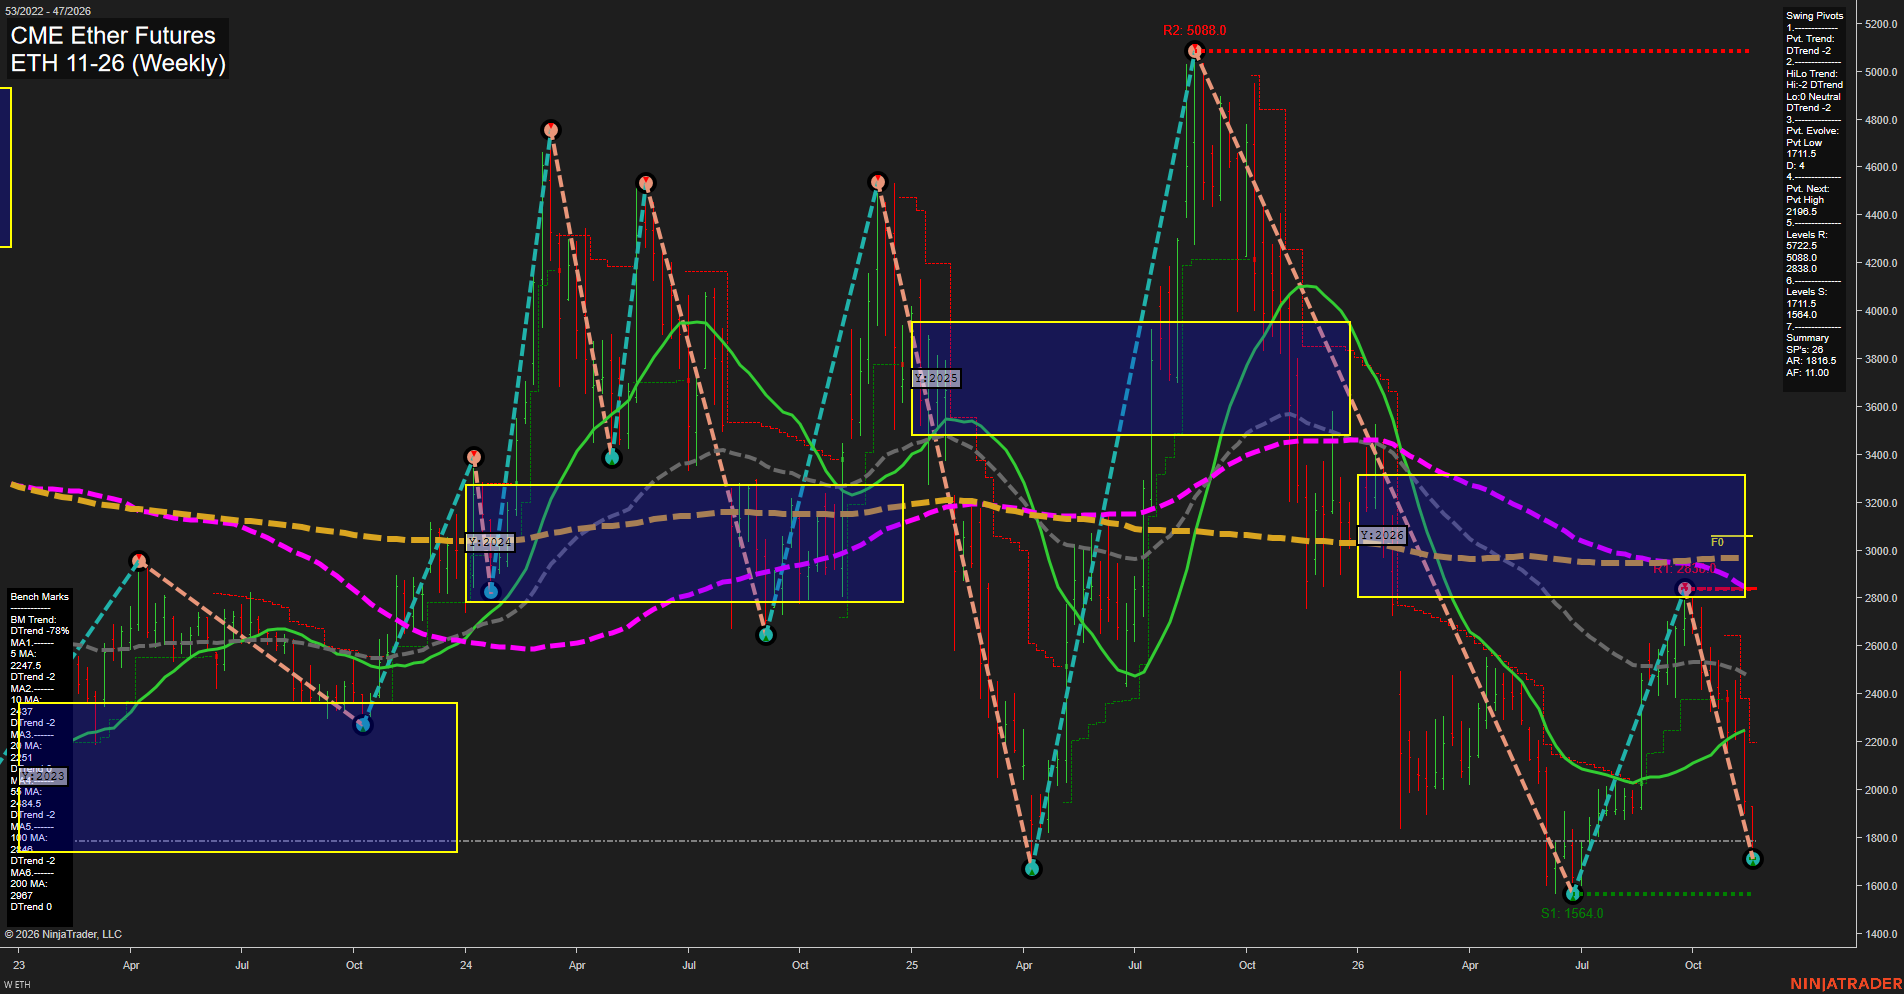
ETH CME Ether Futures Weekly Chart Analysis — Pre-Open: 2026-Nov-18 07:06 CT
Price Action
- Last: Approximately 1800,
- Bars: Large,
- Mom: Momentum fast.
WSFG Weekly
- Near-Term
- WSFG Current: -6%
- F0%/NTZ' Bias: Price Below,
- WSFG Trend: Down.
MSFG Month Nov
- Medium-Term
- MSFG Current: -77%
- F0%/NTZ' Bias: Price Below,
- MSFG Trend: Down.
YSFG Year 2026
- Far-Term
- YSFG Current: -49%
- F0%/NTZ' Bias: Price Below,
- YSFG Trend: Down.
Swing Pivots
- (Near-Term) 1. Pvt. Trend: DTrend,
- (Medium-Term) 2. HiLo Trend: DTrend,
- 3. Pvt. Evolve: Pvt low 1711.5,
- 4. Pvt. Next: Pvt high 2196.5,
- 5. Levels R: 5722.5, 5088.0, 2838.0,
- 6. Levels S: 1711.5, 1564.0.
Weekly Benchmarks
- (Near-Term) 5 Week: 2247.5 Down Trend,
- (Near-Term) 10 Week: Approximately 2337 Down Trend,
- (Medium-Term) 20 Week: 2251 Up Trend,
- (Medium-Term) 55 Week: Approximately 2484.5 Down Trend,
- (Far-Term) 100 Week: Approximately 2848 Down Trend,
- (Far-Term) 200 Week: 2967 Down Trend.
Recent Trade Signals
- 18 Nov 2026: Short ETH 11-26 @ 1802.5 Signals.USAR-WSFG
Overall Rating
- Near-Term: Bearish,
- Medium-Term: Bearish,
- Far-Term: Bearish.
Key Insights Summary
The weekly swing structure reflects renewed downside acceleration after the rebound stalled at 2838, well below the prior 5088 peak. Large declining bars and price beneath all six benchmarks support a bearish trend-continuation interpretation rather than a confirmed recovery. The evolving 1711.5 pivot low sits above major support at 1564, leaving a higher-low possibility unresolved while both pivot trends remain down. The summary identifies 2196.5 as the next opposite-pivot threshold, not an established resistance pivot. The rising 20-week benchmark is a countertrend exception within otherwise weak benchmark alignment. Price below the weekly, monthly and yearly neutral zones reinforces the bearish cross-timeframe reading, consistent with the supplied weekly short signal. No additional signal history, news catalyst or seasonal evidence is established by this chart.
Chart Analysis ATS AI Generated: 2026-11-18 07:06 for Informational use only, not trading advice. Terms and Risk Disclosure Copyright © 2026. Algo Trading Systems LLC.