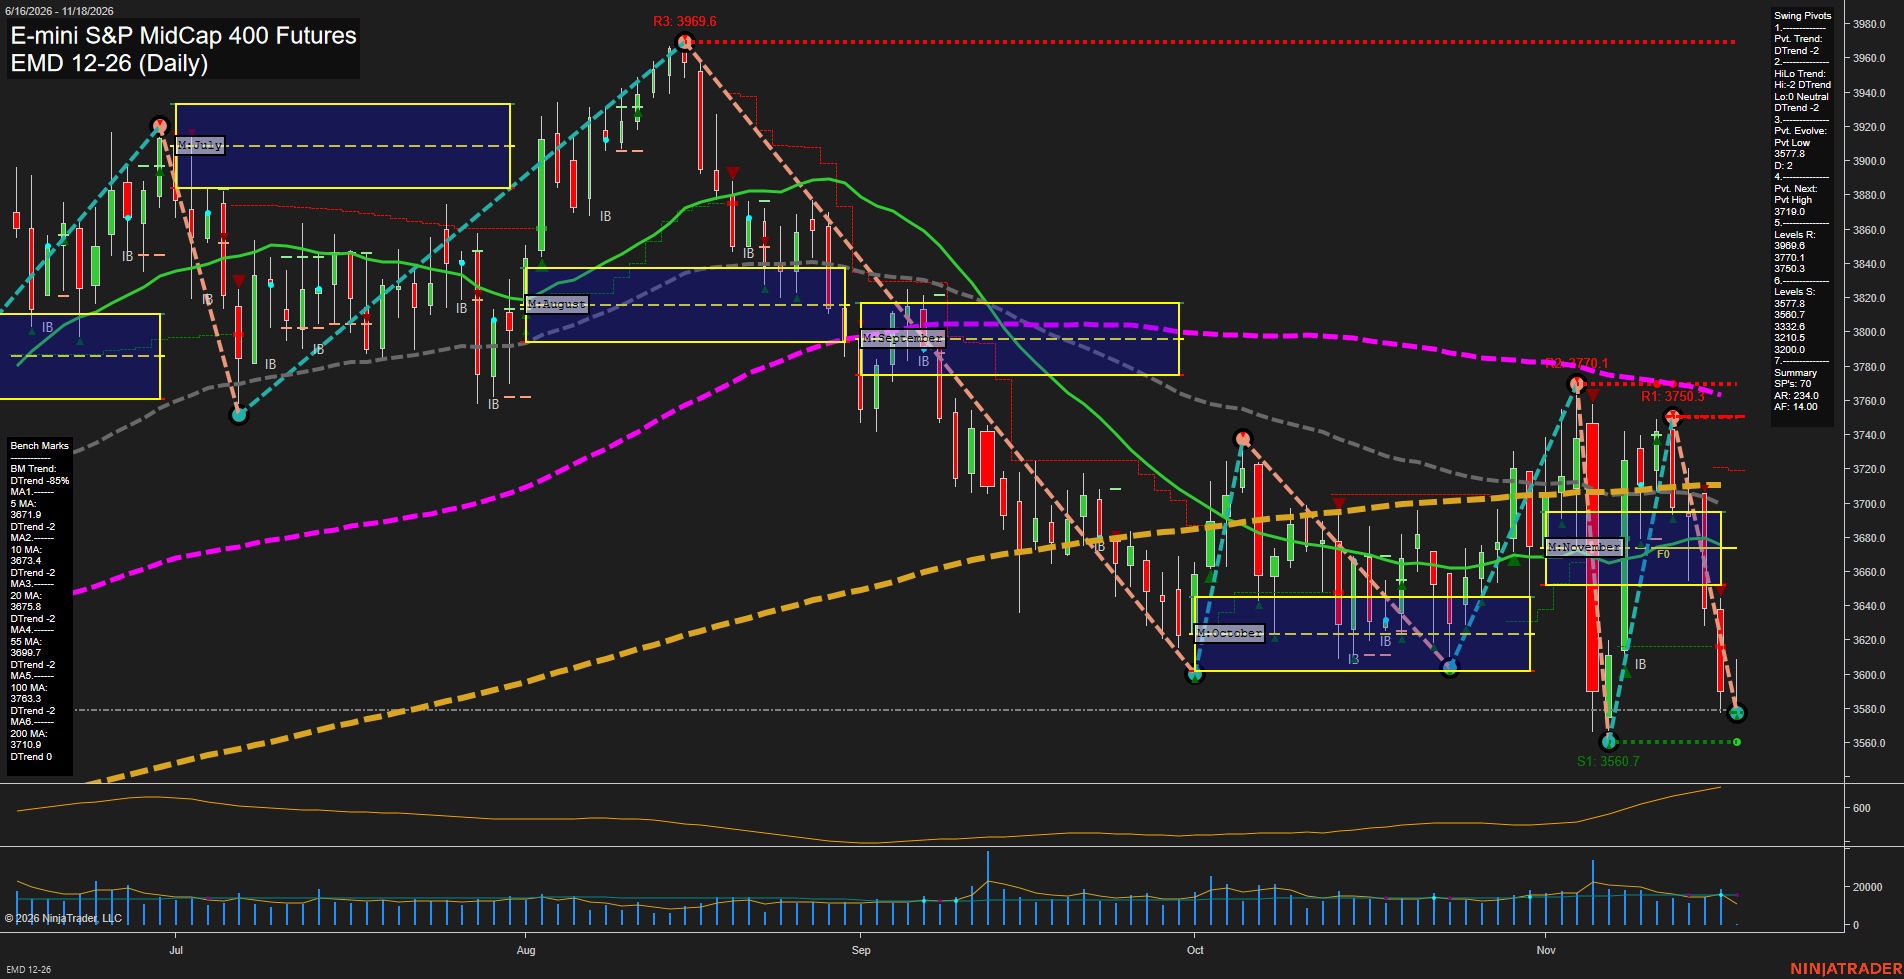
EMD E-mini S&P MidCap 400 Futures Daily Chart Analysis — Pre-Open: 2026-Nov-18 07:04 CT
Price Action
- Last: 3578 approximately,
- Bars: Large,
- Mom: Momentum fast.
WSFG Weekly
- Near-Term
- WSFG Current: -93%
- F0%/NTZ' Bias: Price Below,
- WSFG Trend: Down.
MSFG Month Nov
- Medium-Term
- MSFG Current: -59%
- F0%/NTZ' Bias: Price Below,
- MSFG Trend: Down.
YSFG Year 2026
- Far-Term
- YSFG Current: 17%
- F0%/NTZ' Bias: Price Above,
- YSFG Trend: Up.
Swing Pivots
- (Near-Term) 1. Pvt. Trend: DTrend,
- (Medium-Term) 2. HiLo Trend: DTrend,
- 3. Pvt. Evolve: Pvt low 3577.8,
- 4. Pvt. Next: Pvt high 3719.0,
- 5. Levels R: 3969.6, 3770.1, 3750.3,
- 6. Levels S: 3577.8, 3560.7, 3332.6, 3210.5, 3200.0.
Daily Benchmarks
- (Near-Term) 5 Day: 3671.9 Down Trend,
- (Near-Term) 10 Day: 3673.4 Down Trend,
- (Medium-Term) 20 Day: 3675.8 Down Trend,
- (Medium-Term) 55 Day: 3699.7 Down Trend,
- (Far-Term) 100 Day: 3763.3 Down Trend,
- (Far-Term) 200 Day: 3710.9 Down Trend.
Additional Metrics
Recent Trade Signals
- 16 Nov 2026: Short EMD 12-26 @ 3649.5 Signals.USAR-MSFG
- 12 Nov 2026: Short EMD 12-26 @ 3697.7 Signals.USAR.TR120
Overall Rating
- Near-Term: Bearish,
- Medium-Term: Bearish,
- Far-Term: Bearish.
Key Insights Summary
From a futures swing trader’s perspective, the failed November rebound and subsequent sharp selloff reinforce bearish near- and medium-term structure. The lower swing high at 3750.3 versus 3770.1 reflects weakening rallies, while price below every benchmark and both weekly and monthly NTZs confirms broad downside alignment. The evolving 3577.8 pivot is testing the vicinity of the prior 3560.7 low rather than establishing a confirmed breakdown beneath it. Large bearish bars and rising ATR indicate expanding volatility and fast downside momentum. The recent short signals align with this deterioration. Far-term conditions are bearish by the benchmark majority, although the positive yearly grid remains a counterpoint. News catalysts and seasonal effects cannot be established from this chart alone.
Chart Analysis ATS AI Generated: 2026-11-18 07:05 for Informational use only, not trading advice. Terms and Risk Disclosure Copyright © 2026. Algo Trading Systems LLC.