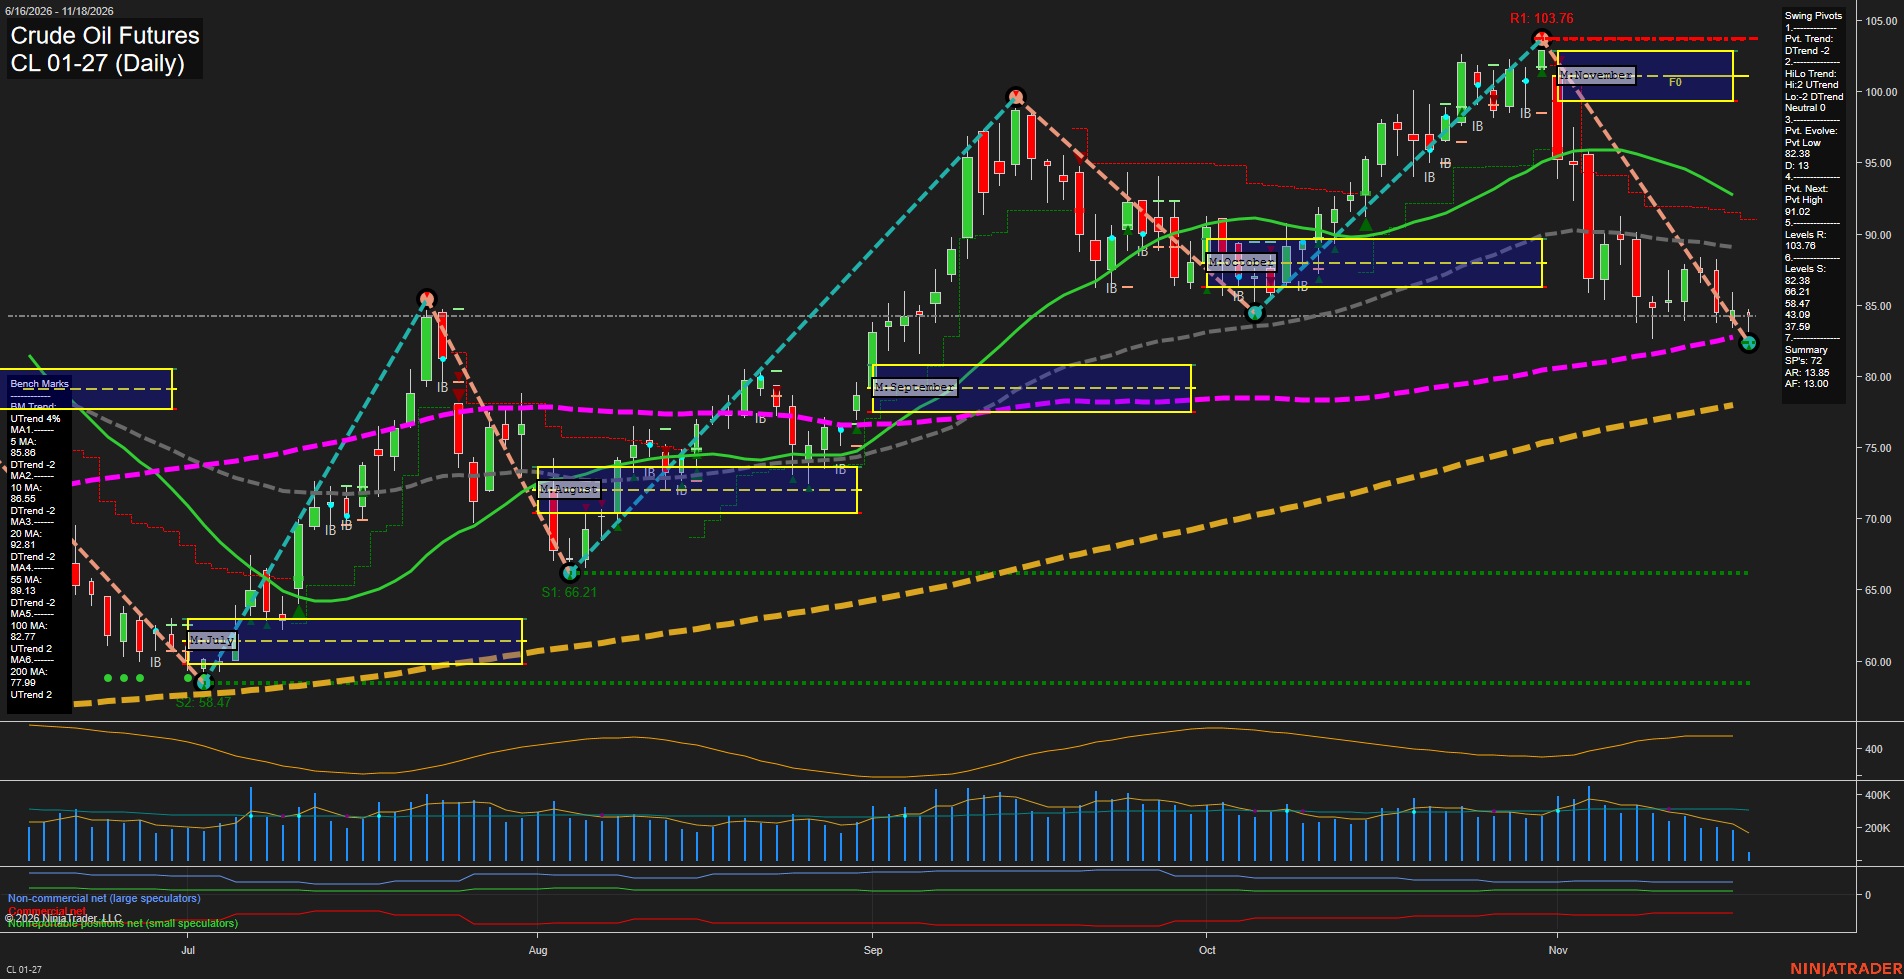
CL Crude Oil Futures Daily Chart Analysis — Pre-Open: 2026-Nov-18 07:03 CT
Price Action
- Last: Approximately 84.30,
- Bars: Small,
- Mom: Momentum slow.
WSFG Weekly
- Near-Term
- WSFG Current: -34%
- F0%/NTZ' Bias: Price Below,
- WSFG Trend: Down.
MSFG Month Nov
- Medium-Term
- MSFG Current: -97%
- F0%/NTZ' Bias: Price Below,
- MSFG Trend: Down.
YSFG Year 2026
- Far-Term
- YSFG Current: 142%
- F0%/NTZ' Bias: Price Above,
- YSFG Trend: Up.
Swing Pivots
- (Near-Term) 1. Pvt. Trend: DTrend,
- (Medium-Term) 2. HiLo Trend: Neutral,
- 3. Pvt. Evolve: Pvt low 82.38,
- 4. Pvt. Next: Pvt high 91.02,
- 5. Levels R: 103.76,
- 6. Levels S: 82.38, 66.21, 58.47, 43.09, 37.59.
Daily Benchmarks
- (Near-Term) 5 Day: 85.86 Down Trend,
- (Near-Term) 10 Day: 86.55 Down Trend,
- (Medium-Term) 20 Day: 92.81 Down Trend,
- (Medium-Term) 55 Day: 89.13 Down Trend,
- (Far-Term) 100 Day: 82.77 Up Trend,
- (Far-Term) 200 Day: 77.99 Up Trend.
Additional Metrics
Recent Trade Signals
- 16 Nov 2026: Short CL 12-26 @ 86.1 Signals.USAR.TR120
- 16 Nov 2026: Short CL 12-26 @ 86.85 Signals.USAR-WSFG
Overall Rating
- Near-Term: Bearish,
- Medium-Term: Bearish,
- Far-Term: Bullish.
Key Insights Summary
From a futures swing perspective, November's decline from 103.76 represents a sharp corrective downswing within a still-rising longer-term trend. Price remains below the falling 5-, 10-, 20- and 55-day benchmarks, while negative weekly and monthly grids reinforce bearish near- and medium-term conditions. Recent smaller candles indicate slowing immediate momentum rather than a confirmed reversal. The developing 82.38 pivot low and rising 100-day benchmark at 82.77 form a nearby support cluster; the next opposite-pivot threshold is 91.02. Mixed high/low pivot structure leaves the medium-term swing classification neutral despite bearish moving-average alignment. Rising 100- and 200-day benchmarks support the bullish far-term rating. The supplied short signals reference December futures, whereas this chart displays January futures, so their execution prices are not directly comparable. News and seasonal drivers cannot be established from the chart alone.
Chart Analysis ATS AI Generated: 2026-11-18 07:03 for Informational use only, not trading advice. Terms and Risk Disclosure Copyright © 2026. Algo Trading Systems LLC.