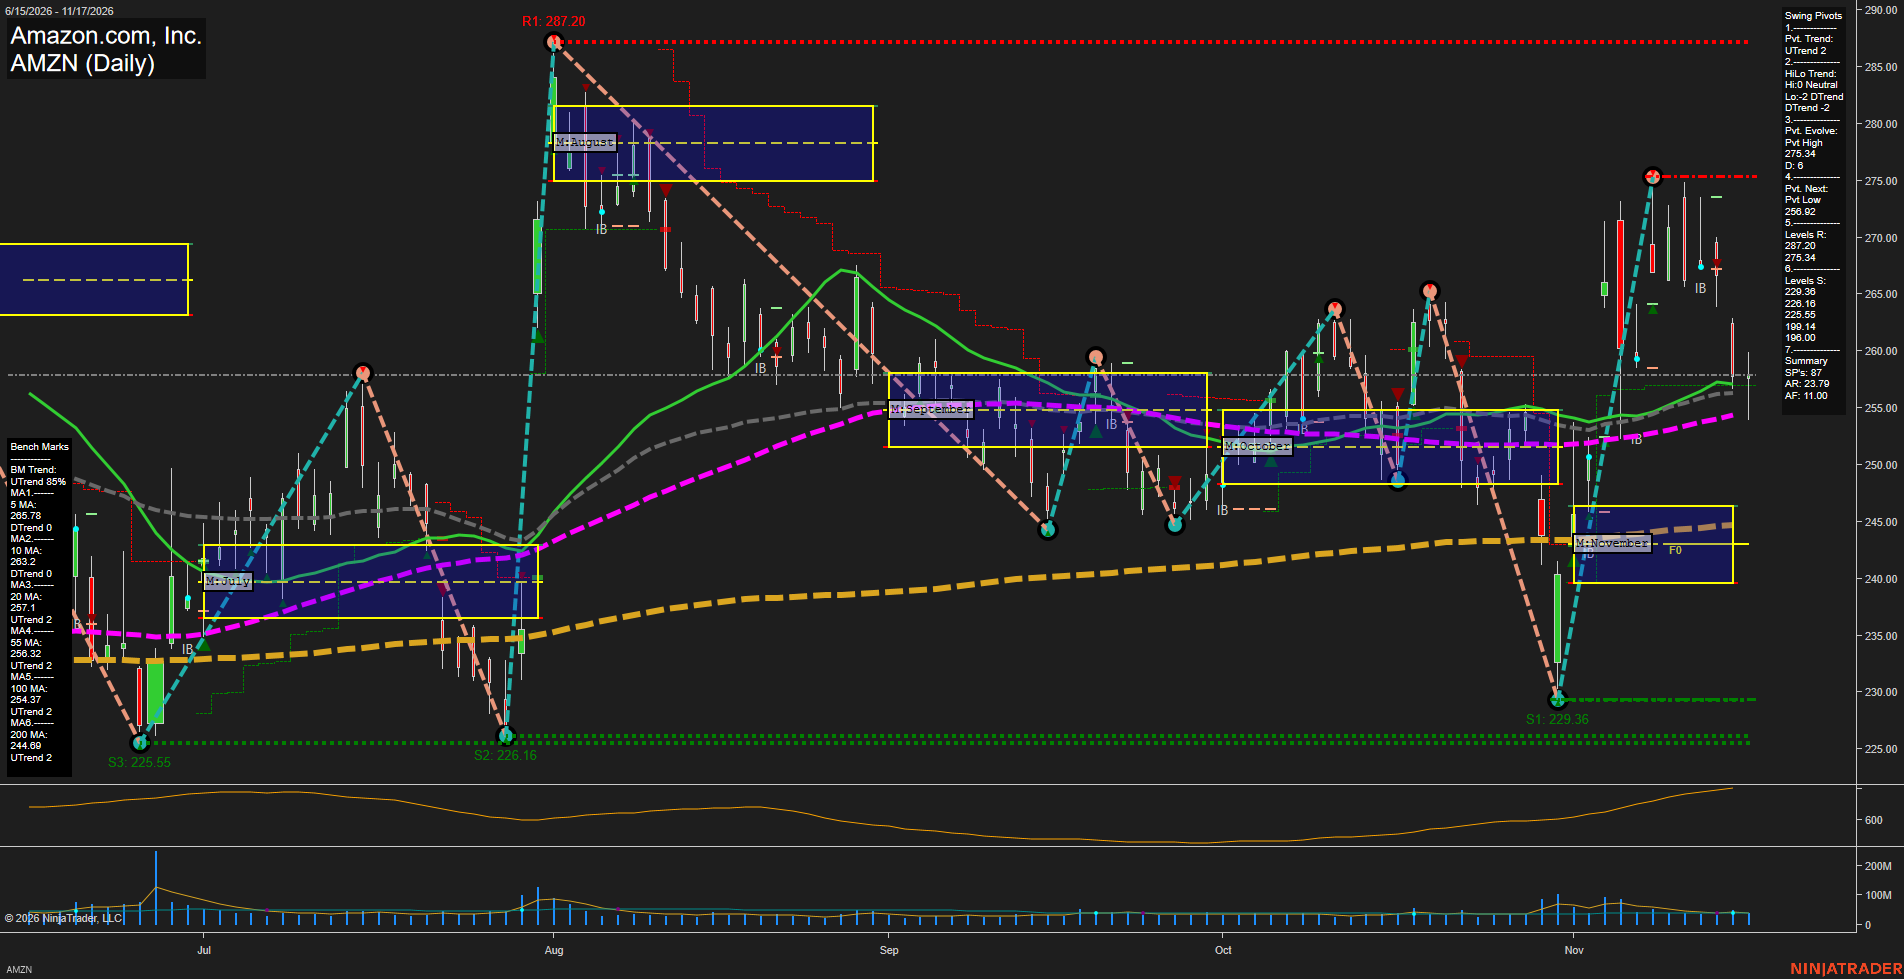
AMZN Amazon.com; Inc. Daily Chart Analysis — Pre-Open: 2026-Nov-18 07:02 CT
Price Action
- Last: approximately 257.90,
- Bars: Large,
- Mom: Momentum fast.
WSFG Weekly
- Near-Term
- WSFG Current: NA%
- F0%/NTZ' Bias: Price Neutral,
- WSFG Trend: Neutral.
MSFG Month Nov
- Medium-Term
- MSFG Current: NA%
- F0%/NTZ' Bias: Price above F0% and NTZ,
- MSFG Trend: Bullish.
YSFG Year 2026
- Far-Term
- YSFG Current: NA%
- F0%/NTZ' Bias: Price Neutral,
- YSFG Trend: Neutral.
Swing Pivots
- (Near-Term) 1. Pvt. Trend: UTrend,
- (Medium-Term) 2. HiLo Trend: DTrend,
- 3. Pvt. Evolve: Pvt high 275.34,
- 4. Pvt. Next: Pvt low 256.92,
- 5. Levels R: 287.20, 275.34,
- 6. Levels S: 229.36, 226.16, 225.55, 199.14, 196.00.
Daily Benchmarks
- (Near-Term) 5 Day: 265.78 Down Trend,
- (Near-Term) 10 Day: 263.20 Down Trend,
- (Medium-Term) 20 Day: 257.10 Up Trend,
- (Medium-Term) 55 Day: 256.32 Up Trend,
- (Far-Term) 100 Day: 254.37 Up Trend,
- (Far-Term) 200 Day: 244.69 Up Trend.
Additional Metrics
- ATR: 465,
- VOLMA: 33608198.
Overall Rating
- Near-Term: Bearish,
- Medium-Term: Bullish,
- Far-Term: Bullish.
Key Insights Summary
From a futures swing trader’s perspective, AMZN shows a fast countertrend pullback within an improving broader benchmark structure. The rebound from 229.36 to 275.34 has retraced toward the rising 20- and 55-day averages at 257.10 and 256.32, with price below both declining near-term averages. The pivot summary still reports a near-term uptrend, but its 256.92 reversal threshold is close to the latest price; the medium-term HiLo structure remains bearish. This creates a contested trend area rather than a clean continuation pattern. Below that cluster, the rising 100-day average at 254.37 provides another structural reference, while overhead pivot resistance stands at 275.34 and 287.20. Price remains above November’s monthly neutral zone, approximately 240–246, supporting the bullish monthly context despite the sharp retreat. Expanding daily ranges indicate elevated volatility. Weekly and yearly grids, named signal-series readings, and news catalysts are not displayed, so their directional contributions cannot be verified. AMZN is an equity chart; these observations describe its underlying swing structure, not futures-contract pricing.
Chart Analysis ATS AI Generated: 2026-11-18 07:02 for Informational use only, not trading advice. Terms and Risk Disclosure Copyright © 2026. Algo Trading Systems LLC.