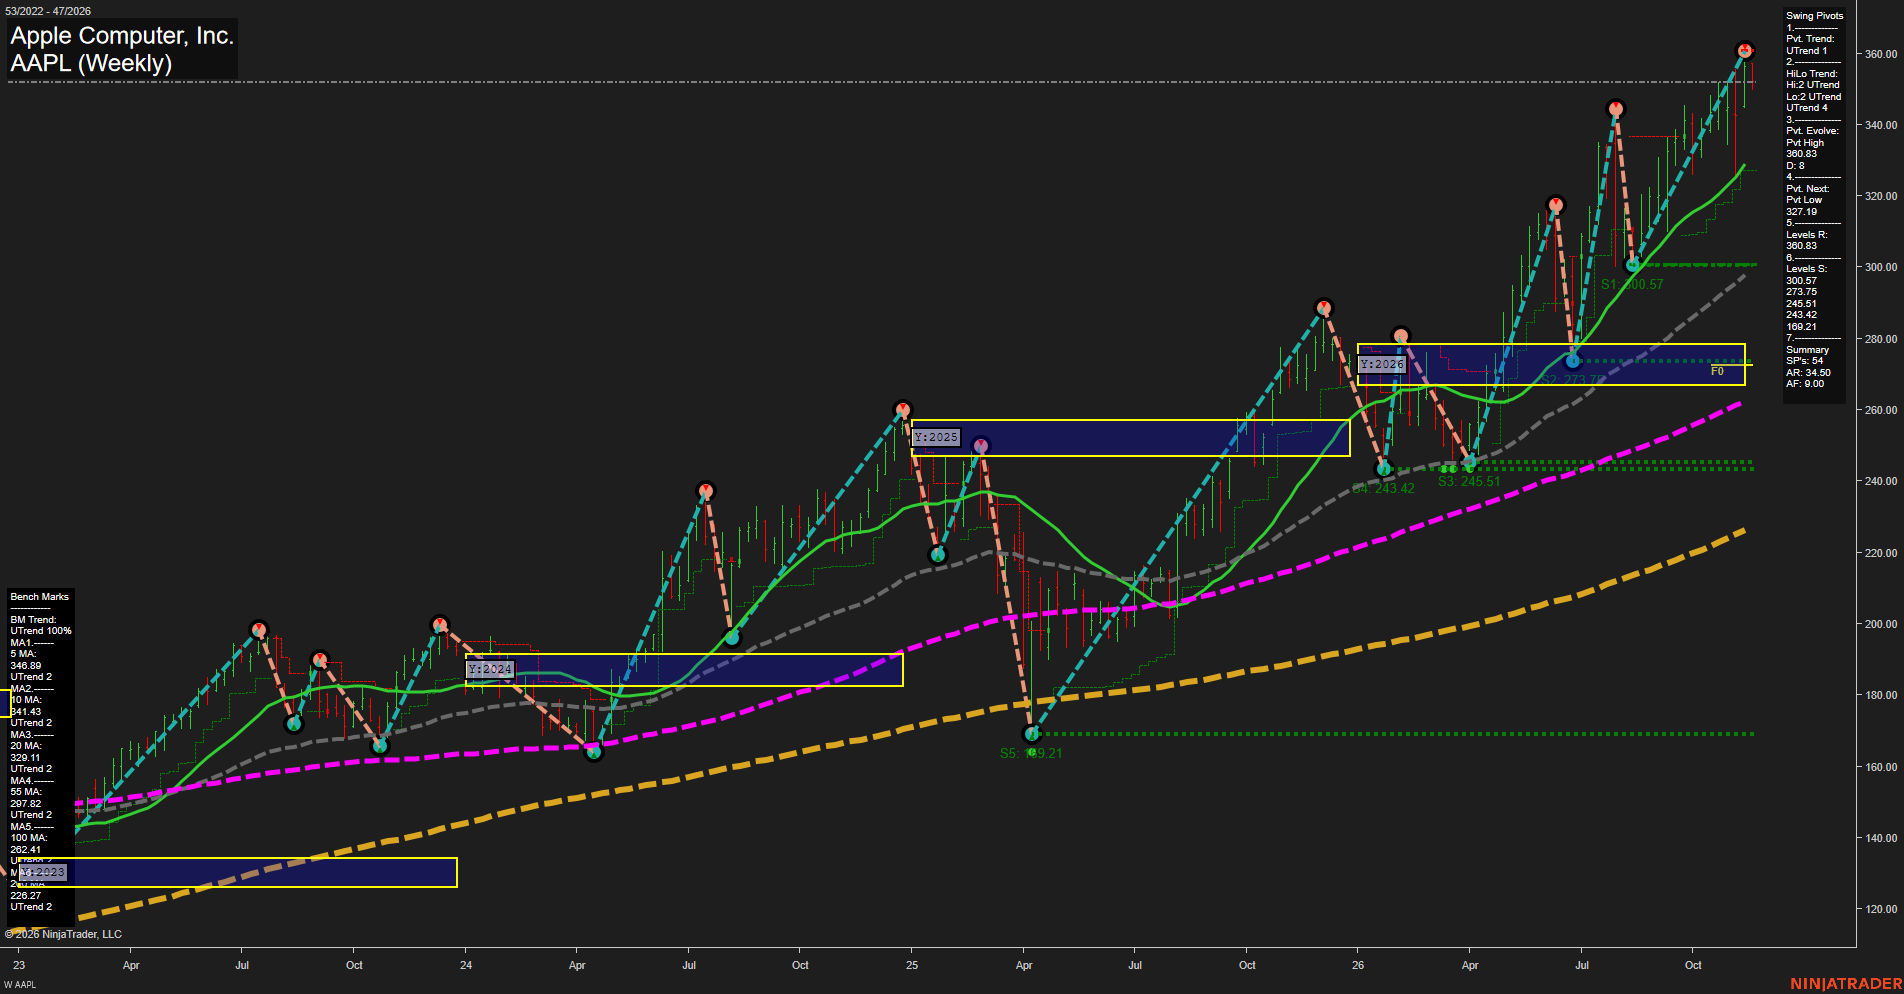
AAPL Apple Computer; Inc. Weekly Chart Analysis — Pre-Open: 2026-Nov-18 07:02 CT
Price Action
- Last: Approximately 352,
- Bars: Medium,
- Mom: Momentum fast.
WSFG Weekly
- Near-Term
- WSFG Current: NA%
- F0%/NTZ' Bias: Price Neutral,
- WSFG Trend: Neutral.
MSFG Month Nov
- Medium-Term
- MSFG Current: NA%
- F0%/NTZ' Bias: Price Neutral,
- MSFG Trend: Neutral.
YSFG Year 2026
- Far-Term
- YSFG Current: NA%
- F0%/NTZ' Bias: Price above NTZ,
- YSFG Trend: Bullish.
Swing Pivots
- (Near-Term) 1. Pvt. Trend: UTrend,
- (Medium-Term) 2. HiLo Trend: UTrend,
- 3. Pvt. Evolve: Pvt high 360.83,
- 4. Pvt. Next: Pvt low 327.19,
- 5. Levels R: 360.83,
- 6. Levels S: 300.57, 273.75, 245.51, 243.42, 169.21.
Weekly Benchmarks
- (Near-Term) 5 Week: 346.89 Up Trend,
- (Near-Term) 10 Week: 341.43 Up Trend,
- (Medium-Term) 20 Week: 329.11 Up Trend,
- (Medium-Term) 55 Week: 297.82 Up Trend,
- (Far-Term) 100 Week: 262.41 Up Trend,
- (Far-Term) 200 Week: 226.27 Up Trend.
Overall Rating
- Near-Term: Bullish,
- Medium-Term: Bullish,
- Far-Term: Bullish.
Key Insights Summary
From a futures swing trader’s perspective, this equity chart shows aligned upward trends across time horizons, with higher swing highs and lows and price above all six rising benchmarks. The recent advance from 300.57 to 360.83 reflects strong directional momentum, while the latest retreat below that high represents a modest countertrend pause rather than a confirmed pivot reversal. The summary identifies 327.19 as the next opposite-pivot reversal threshold, distinct from established support at 300.57. Price remains substantially above the yearly neutral zone around 267–278, demonstrating strength but also considerable separation from longer-term benchmarks. Weekly and monthly grids and the named recent trade signals are not displayed; their neutral entries indicate unavailable confirmation, not observed neutral signals. No news or seasonal conclusions can be established from this chart alone.
Chart Analysis ATS AI Generated: 2026-11-18 07:02 for Informational use only, not trading advice. Terms and Risk Disclosure Copyright © 2026. Algo Trading Systems LLC.