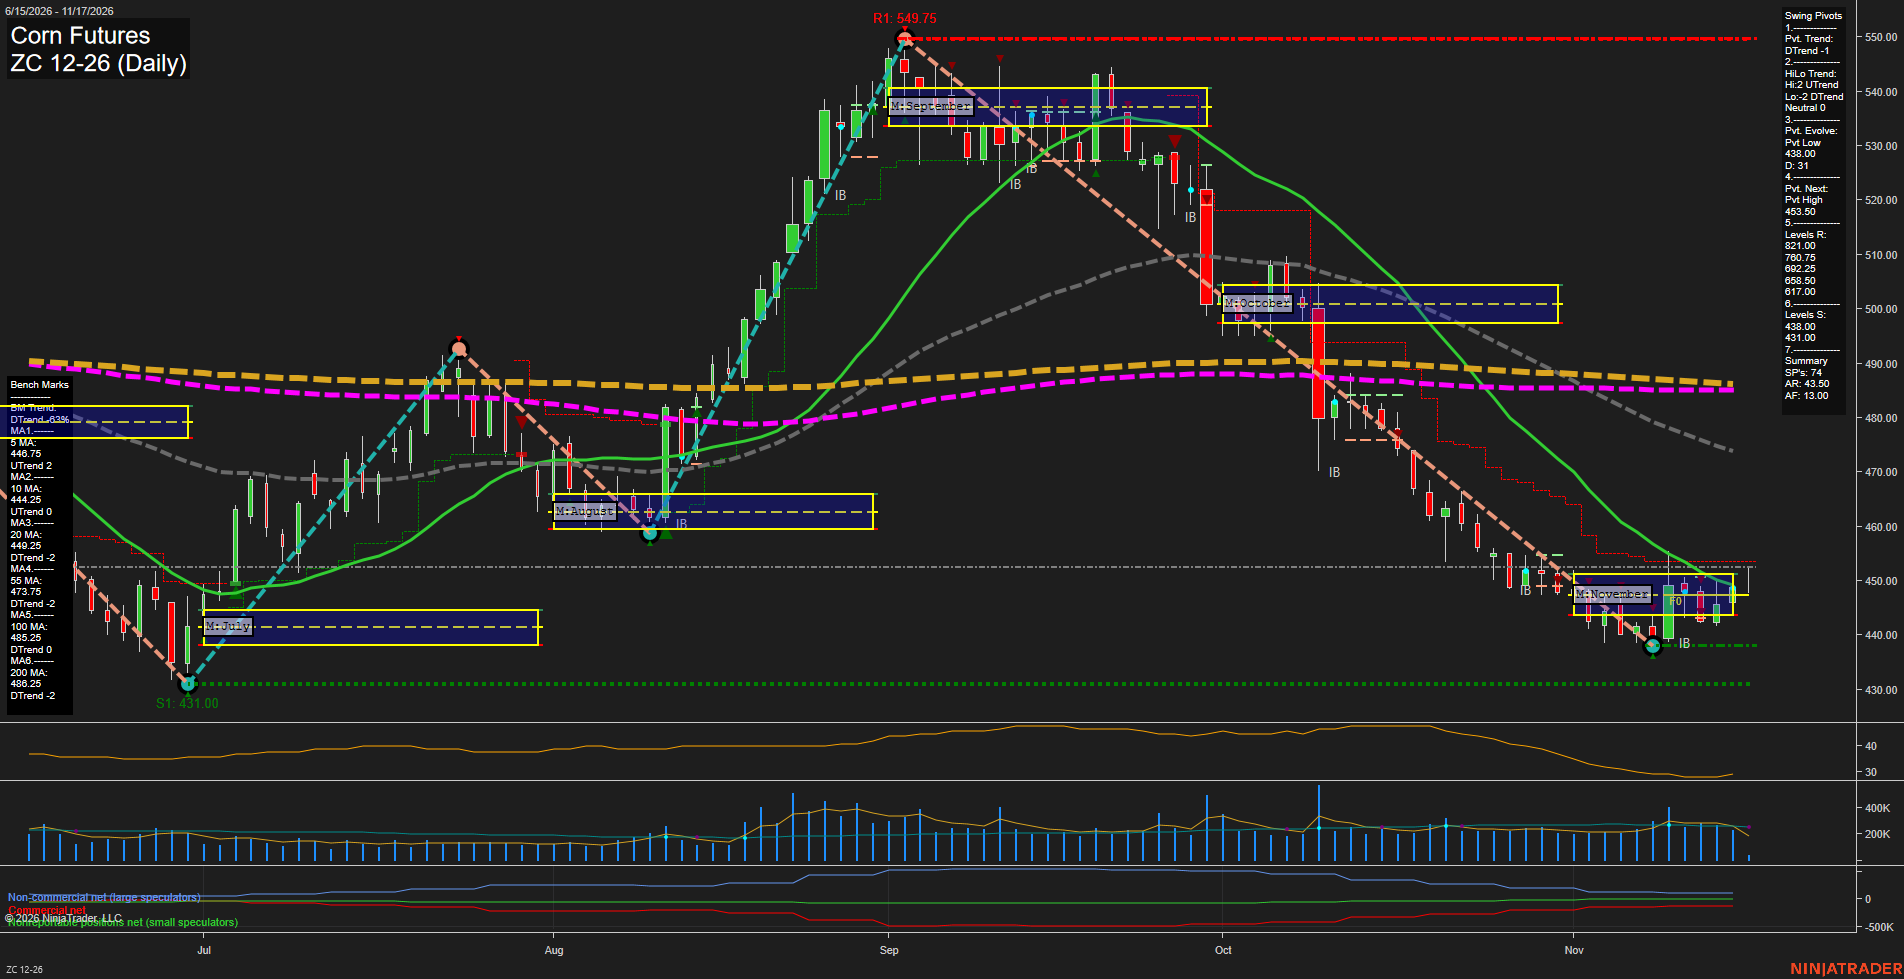
ZC Corn Futures Daily Chart Analysis — Pre-Open: 2026-Nov-17 07:18 CT
Price Action
- Last: approximately 449.25,
- Bars: Small,
- Mom: Momentum slow.
WSFG Weekly
- Near-Term
- WSFG Current: 43%
- F0%/NTZ' Bias: Price Above,
- WSFG Trend: Up.
MSFG Month Nov
- Medium-Term
- MSFG Current: 9%
- F0%/NTZ' Bias: Price Above,
- MSFG Trend: Up.
YSFG Year 2026
- Far-Term
- YSFG Current: -34%
- F0%/NTZ' Bias: Price Below,
- YSFG Trend: Down.
Swing Pivots
- (Near-Term) 1. Pvt. Trend: DTrend,
- (Medium-Term) 2. HiLo Trend: Neutral,
- 3. Pvt. Evolve: Pvt low 438.00,
- 4. Pvt. Next: Pvt high 453.50,
- 5. Levels R: 821.00, 700.75, 692.25, 658.50, 617.00,
- 6. Levels S: 438.00, 431.00.
Daily Benchmarks
- (Near-Term) 5 Day: 446.75 Up Trend,
- (Near-Term) 10 Day: 444.25 Up Trend,
- (Medium-Term) 20 Day: 449.25 Down Trend,
- (Medium-Term) 55 Day: 473.75 Down Trend,
- (Far-Term) 100 Day: 485.25 Down Trend,
- (Far-Term) 200 Day: 486.25 Down Trend.
Additional Metrics
Recent Trade Signals
- 16 Nov 2026: Long ZC 12-26 @ 448.5 Signals.USAR-WSFG
- 10 Nov 2026: Short ZC 12-26 @ 440.75 Signals.USAR-MSFG
Overall Rating
- Near-Term: Bullish,
- Medium-Term: Bearish,
- Far-Term: Bearish.
Key Insights Summary
Corn is staging a near-term countertrend rebound from 438.00 within the broader decline from September’s 549.75 peak. Rising 5-day and 10-day benchmarks, positive weekly positioning and the latest weekly long signal support the short-term bullish rating. However, the pivot trend remains down, with 453.50 identified as the next pivot-high reversal threshold. Price is testing the declining 20-day benchmark near 449.25 while remaining well below the 55-day and longer-term averages. The monthly grid has turned positive, but the recent monthly short signal and falling medium-term benchmarks leave the broader recovery unconfirmed. The HiLo summary is neutral, reflecting mixed high-and-low pivot structure. Support remains at 438.00 and 431.00. Small recent candles and slow momentum characterize stabilization rather than an established upside trend; the chart alone does not establish a news or seasonal catalyst.
Chart Analysis ATS AI Generated: 2026-11-17 07:18 for Informational use only, not trading advice. Terms and Risk Disclosure Copyright © 2026. Algo Trading Systems LLC.