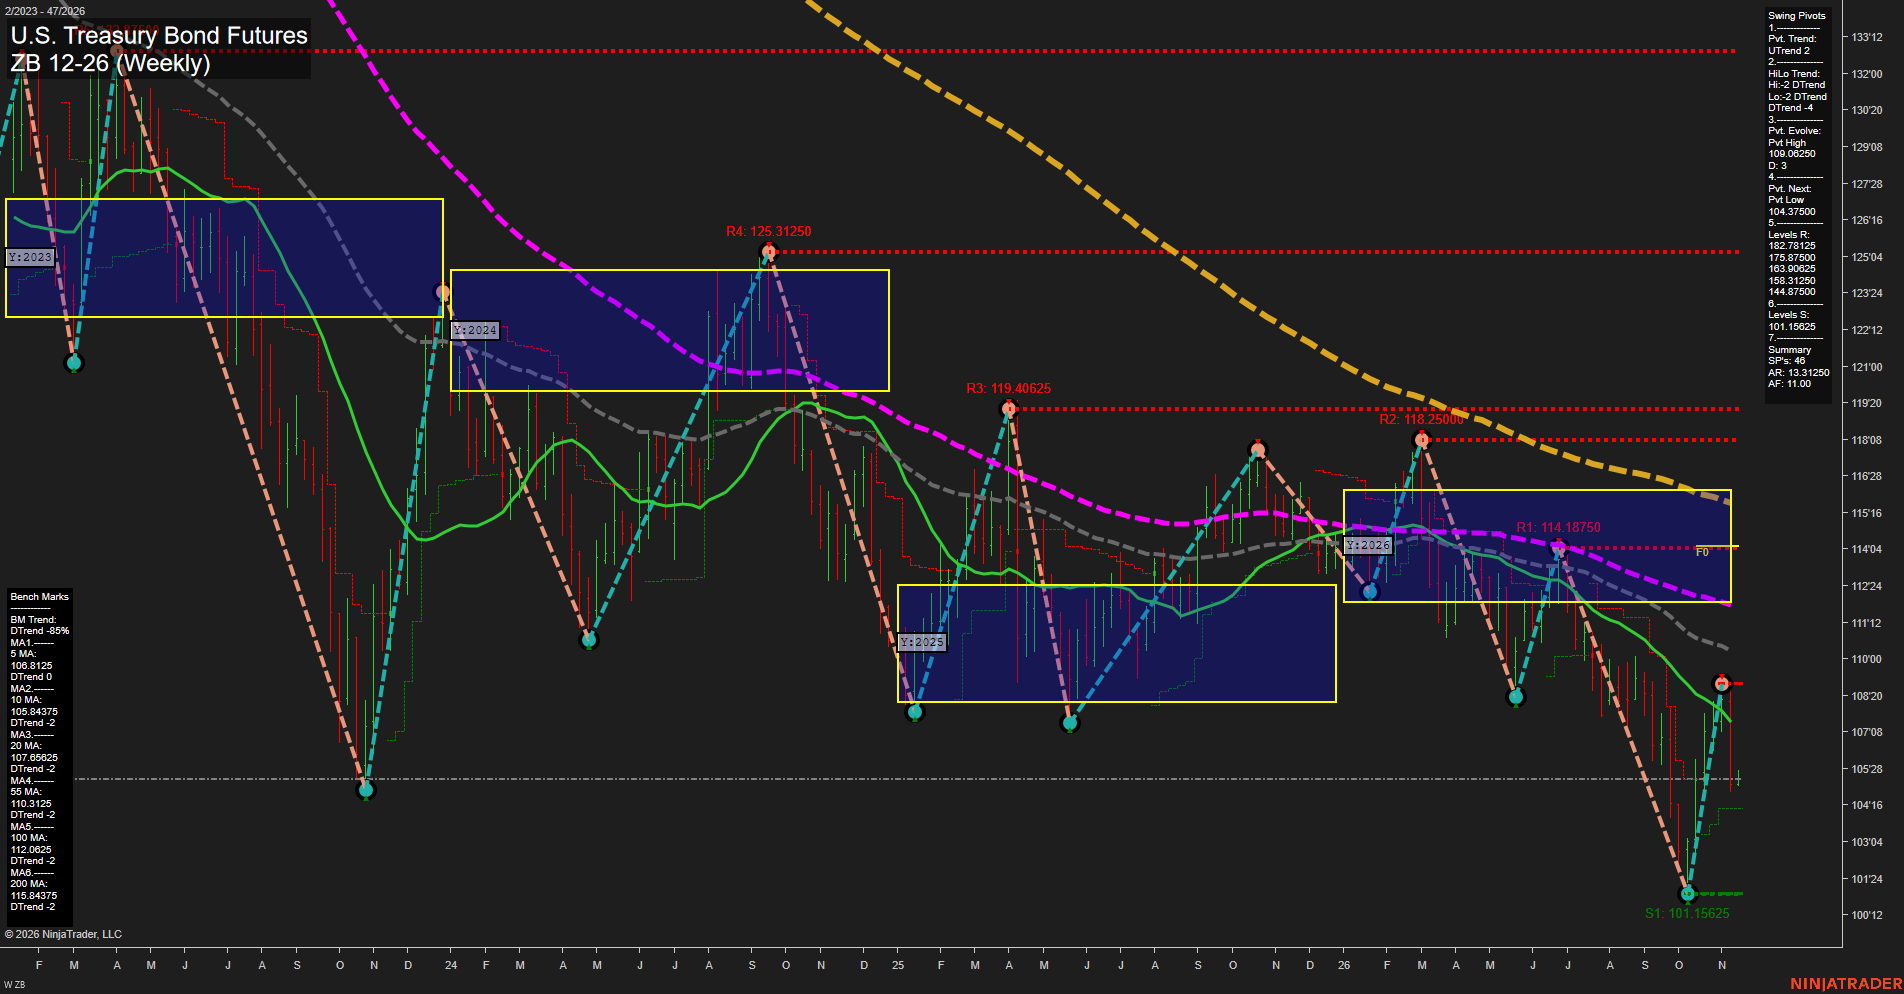
ZB U.S. Treasury Bond Futures Weekly Chart Analysis — Pre-Open: 2026-Nov-17 07:17 CT
Price Action
- Last: Approximately 105.50,
- Bars: Large,
- Mom: Momentum fast.
WSFG Weekly
- Near-Term
- WSFG Current: 9%
- F0%/NTZ' Bias: Price Above,
- WSFG Trend: Up.
MSFG Month Nov
- Medium-Term
- MSFG Current: -43%
- F0%/NTZ' Bias: Price Below,
- MSFG Trend: Down.
YSFG Year 2026
- Far-Term
- YSFG Current: -41%
- F0%/NTZ' Bias: Price Below,
- YSFG Trend: Down.
Swing Pivots
- (Near-Term) 1. Pvt. Trend: UTrend,
- (Medium-Term) 2. HiLo Trend: DTrend,
- 3. Pvt. Evolve: Pvt high 109.06250,
- 4. Pvt. Next: Pvt low 104.37500,
- 5. Levels R: 182.78125, 175.87500, 163.90625, 158.31250, 144.87500,
- 6. Levels S: 101.15625.
Weekly Benchmarks
- (Near-Term) 5 Week: 106.8125 Down Trend,
- (Near-Term) 10 Week: 105.84375 Down Trend,
- (Medium-Term) 20 Week: 107.65625 Down Trend,
- (Medium-Term) 55 Week: 110.3125 Down Trend,
- (Far-Term) 100 Week: 112.0625 Down Trend,
- (Far-Term) 200 Week: 115.84375 Down Trend.
Overall Rating
- Near-Term: Bullish,
- Medium-Term: Bearish,
- Far-Term: Bearish.
Key Insights Summary
The near-term bullish rating narrowly reflects the rising weekly grid and upward pivot trend, but the swing-trading structure remains a countertrend rebound within a broader decline. The recovery from 101.15625 reached an evolving pivot high of 109.06250 before a substantial pullback toward 105.50. Price is below all six declining benchmarks, while medium-term pivots retain a lower-high/lower-low structure. The 104.37500 next-pivot threshold defines the chart’s nearby reversal reference. Overhead, plotted resistance appears at 114.18750, 118.25000, 119.40625 and 125.31250; these differ from the much higher resistance values in the Swing Pivots summary reproduced above. Weekly strength therefore contrasts with bearish monthly and yearly conditions rather than confirming a sustained trend reversal. Recent signal indicators are not visible, so they cannot independently validate the ratings; news and seasonal explanations are likewise not established by this chart.
Chart Analysis ATS AI Generated: 2026-11-17 07:18 for Informational use only, not trading advice. Terms and Risk Disclosure Copyright © 2026. Algo Trading Systems LLC.