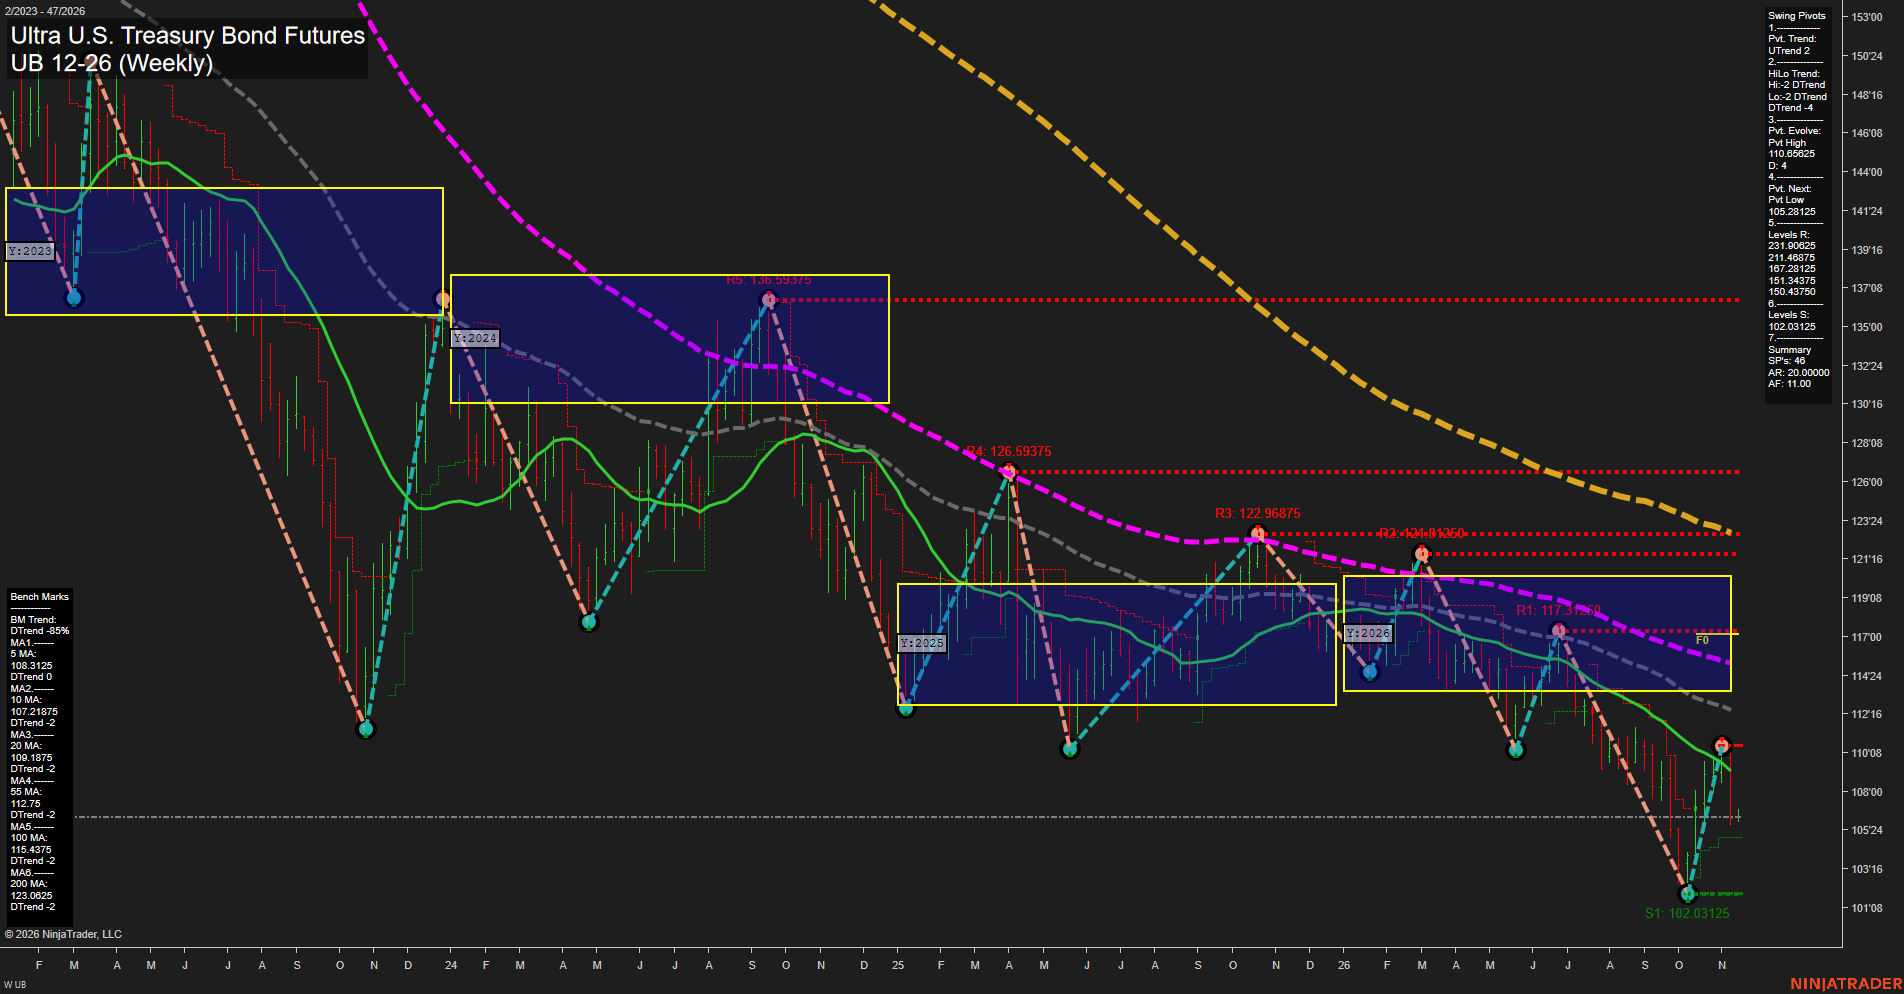
UB Ultra U.S. Treasury Bond Futures Weekly Chart Analysis — Pre-Open: 2026-Nov-17 07:16 CT
Price Action
- Last: Approximately 106.50,
- Bars: Small,
- Mom: Momentum fast.
WSFG Weekly
- Near-Term
- WSFG Current: 3%
- F0%/NTZ' Bias: Price Above,
- WSFG Trend: Up.
MSFG Month Nov
- Medium-Term
- MSFG Current: -45%
- F0%/NTZ' Bias: Price Below,
- MSFG Trend: Down.
YSFG Year 2026
- Far-Term
- YSFG Current: -32%
- F0%/NTZ' Bias: Price Below,
- YSFG Trend: Down.
Swing Pivots
- (Near-Term) 1. Pvt. Trend: UTrend,
- (Medium-Term) 2. HiLo Trend: DTrend,
- 3. Pvt. Evolve: Pvt high 110.65625,
- 4. Pvt. Next: Pvt low 105.28125,
- 5. Levels R: 231.90625, 211.46875, 167.28125, 151.34375, 150.43750,
- 6. Levels S: 102.03125.
Weekly Benchmarks
- (Near-Term) 5 Week: 108.3125 Down Trend,
- (Near-Term) 10 Week: 107.21875 Down Trend,
- (Medium-Term) 20 Week: 109.1875 Down Trend,
- (Medium-Term) 55 Week: 112.75 Down Trend,
- (Far-Term) 100 Week: 115.4375 Down Trend,
- (Far-Term) 200 Week: 123.0625 Down Trend.
Recent Trade Signals
- 12 Nov 2026: Short UB 12-26 @ 107.25 Signals.USAR.TR720
- 12 Nov 2026: Short UB 12-26 @ 108.5 Signals.USAR-MSFG
- 10 Nov 2026: Short UB 12-26 @ 108.6875 Signals.USAR.TR120
Overall Rating
- Near-Term: Bearish,
- Medium-Term: Bearish,
- Far-Term: Bearish.
Key Insights Summary
The weekly structure remains a broad downtrend, with lower swing highs and price beneath all six declining benchmarks. The rebound from 102.03125 to the evolving 110.65625 pivot high appears countertrend; its sharp retracement has returned price below the near-term averages. Positive weekly grid and pivot readings conflict with the bearish near-term benchmark and TR120 signal evidence, leaving the near-term assessment bearish overall. The 105.28125 next-pivot threshold and 102.03125 swing low frame the downside structure, while 107.21875–109.1875 defines the nearby benchmark cluster overhead. Resistance figures above reproduce the Swing Pivots summary, which differs from the nearer resistance labels plotted on the chart. The chart alone does not establish news or seasonal drivers.
Chart Analysis ATS AI Generated: 2026-11-17 07:16 for Informational use only, not trading advice. Terms and Risk Disclosure Copyright © 2026. Algo Trading Systems LLC.