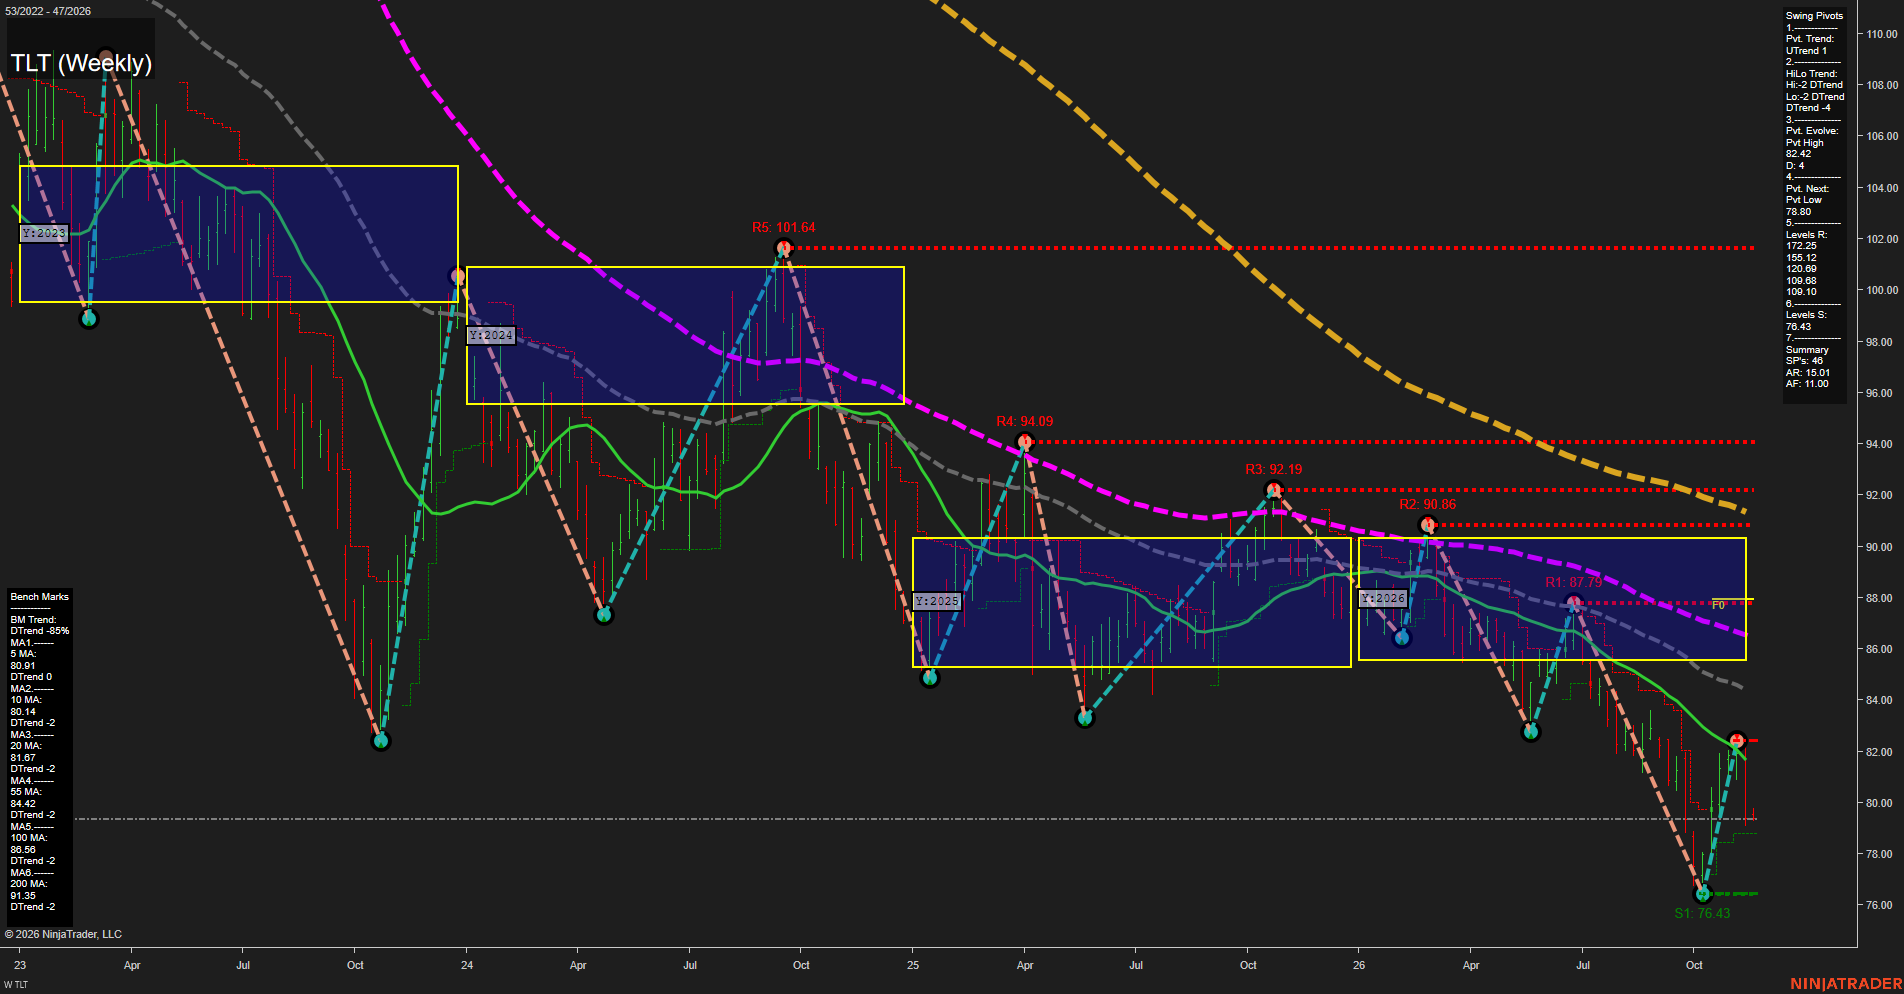
From a futures swing trader’s perspective, TLT depicts a countertrend rebound within a persistent bearish duration trend, rather than a confirmed broader reversal. The recovery from 76.43 to 82.42 established a near-term pivot uptrend, but the latest sharp retreat toward 79.40 places price below all six declining benchmarks. The medium-term pivot structure remains lower highs and lower lows. The 78.80 next-pivot threshold and 76.43 swing low define the nearby downside reference points; 80.14–81.67 forms an overhead benchmark cluster, followed by the evolving 82.42 pivot high. The resistance values above reproduce the summary panel; nearer chart-plotted resistance is 87.79, 90.86, 92.19, 94.09 and 101.64. Price is also below the 2026 yearly neutral zone, reinforcing the longer-horizon bearish reading. Weekly and monthly grids and the specified recent trade signals are not visible, so their neutral entries represent unavailable confirmation rather than demonstrated balance. No news or seasonal catalyst can be established from this chart alone. TLT is a Treasury ETF, so these observations describe a duration-market proxy rather than a specific futures contract.