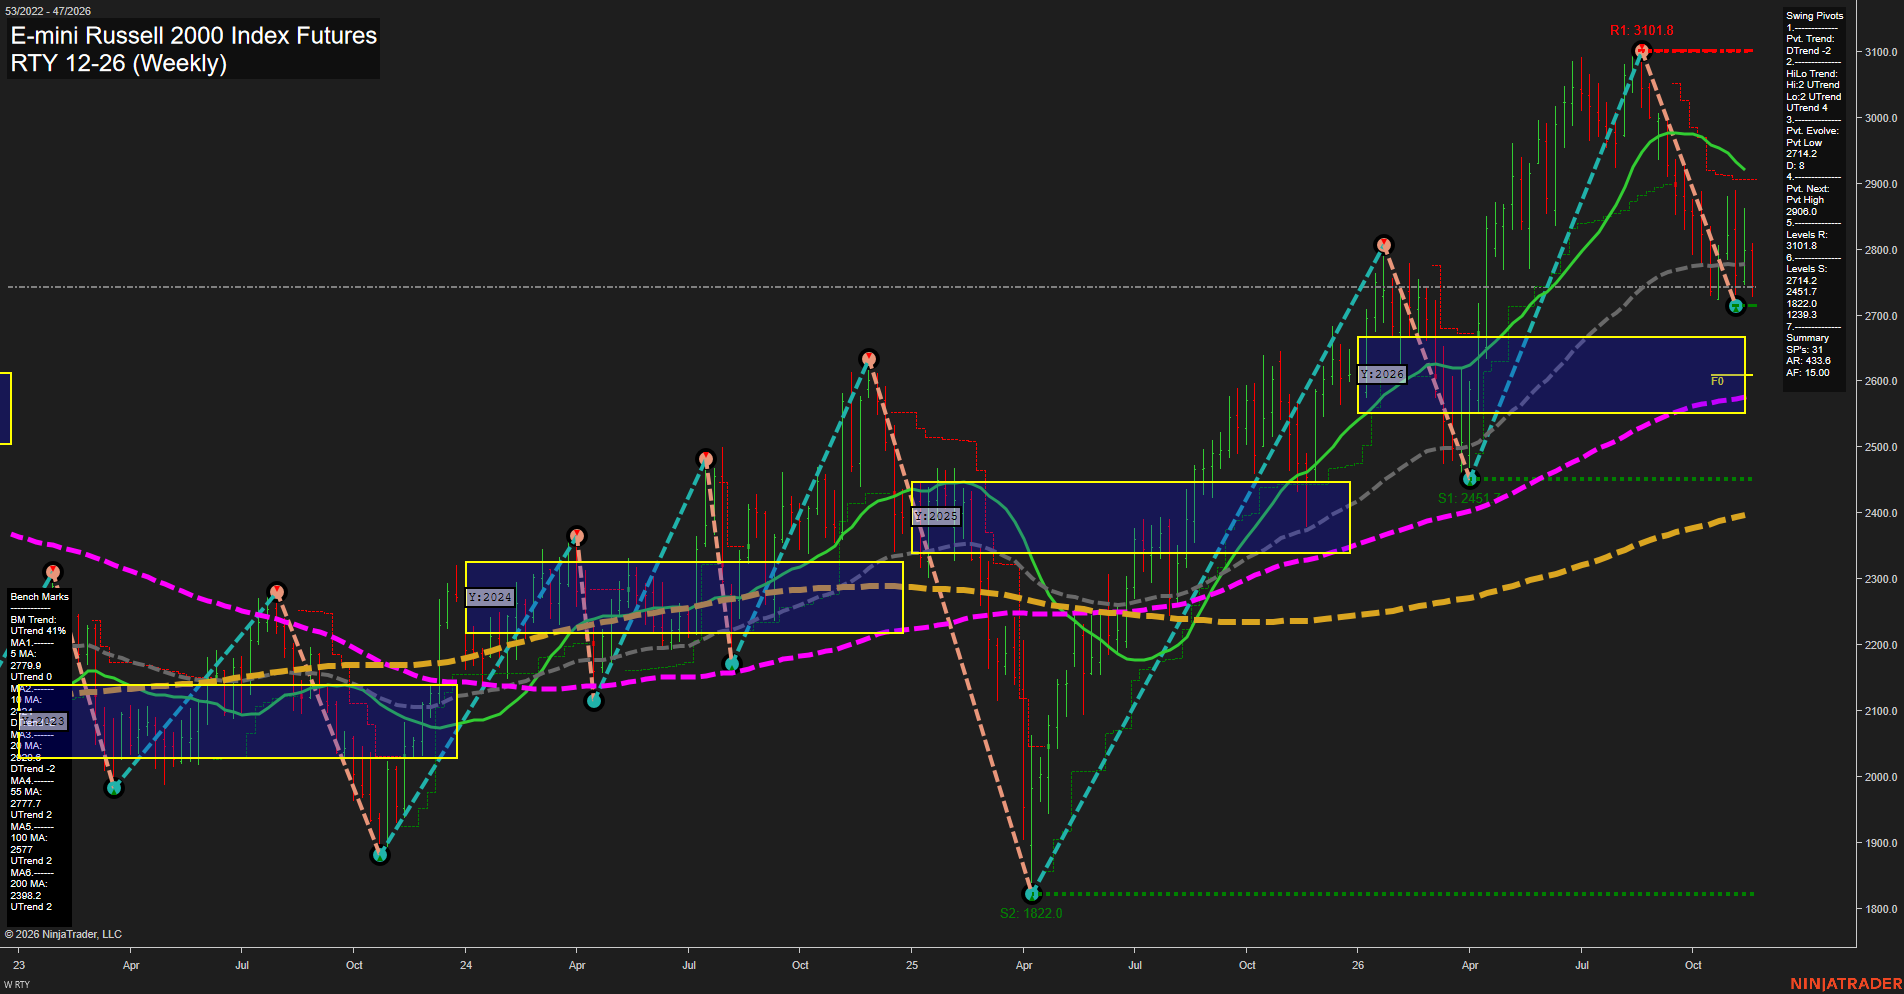
RTY E-mini Russell 2000 Index Futures Weekly Chart Analysis — Pre-Open: 2026-Nov-17 07:12 CT
Price Action
- Last: Approximately 2745,
- Bars: Large,
- Mom: Momentum fast to the downside.
WSFG Weekly
- Near-Term
- WSFG Current: -49%
- F0%/NTZ' Bias: Price Below,
- WSFG Trend: Down.
MSFG Month Nov
- Medium-Term
- MSFG Current: -59%
- F0%/NTZ' Bias: Price Below,
- MSFG Trend: Down.
YSFG Year 2026
- Far-Term
- YSFG Current: 23%
- F0%/NTZ' Bias: Price Above,
- YSFG Trend: Up.
Swing Pivots
- (Near-Term) 1. Pvt. Trend: DTrend,
- (Medium-Term) 2. HiLo Trend: UTrend,
- 3. Pvt. Evolve: Pvt low 2714.2,
- 4. Pvt. Next: Pvt high 2906.0,
- 5. Levels R: 3101.8,
- 6. Levels S: 2714.2, 2451.7, 1822.0, 1239.3.
Weekly Benchmarks
- (Near-Term) 5 Week: 2779.9 Up Trend,
- (Near-Term) 10 Week: Price obscured in summary Down Trend,
- (Medium-Term) 20 Week: Approximately 2920 Down Trend,
- (Medium-Term) 55 Week: 2777.7 Up Trend,
- (Far-Term) 100 Week: 2577 Up Trend,
- (Far-Term) 200 Week: 2398.2 Up Trend.
Recent Trade Signals
- 16 Nov 2026: Short RTY 12-26 @ 2773.2 Signals.USAR-WSFG
- 13 Nov 2026: Short RTY 12-26 @ 2809.6 Signals.USAR-MSFG
- 12 Nov 2026: Short RTY 12-26 @ 2821.1 Signals.USAR.TR120
Overall Rating
- Near-Term: Bearish,
- Medium-Term: Bearish,
- Far-Term: Bullish.
Key Insights Summary
From a futures swing trader’s perspective, this is a sharp corrective downswing within a still-rising longer-term structure. The decline from 3101.8 to the evolving 2714.2 pivot low measures approximately 12.5%, with wide weekly ranges and uneven rebounds reflecting elevated volatility. Price sits below the closely grouped 5- and 55-week benchmarks near 2778–2780, while negative weekly and monthly grids and three recent short signals reinforce near-term selling pressure. Medium-term conditions are bearish overall, although the higher-high/higher-low pivot structure remains classified as an uptrend. The 2906.0 reading is the summary’s next-pivot reversal threshold, distinct from confirmed resistance at 3101.8. Far-term strength persists through the positive yearly grid and rising 100- and 200-week averages; the yearly neutral zone around 2550–2670 remains below current price. No far-term TR720 signal or news catalyst is supplied, so neither is inferred.
Chart Analysis ATS AI Generated: 2026-11-17 07:13 for Informational use only, not trading advice. Terms and Risk Disclosure Copyright © 2026. Algo Trading Systems LLC.