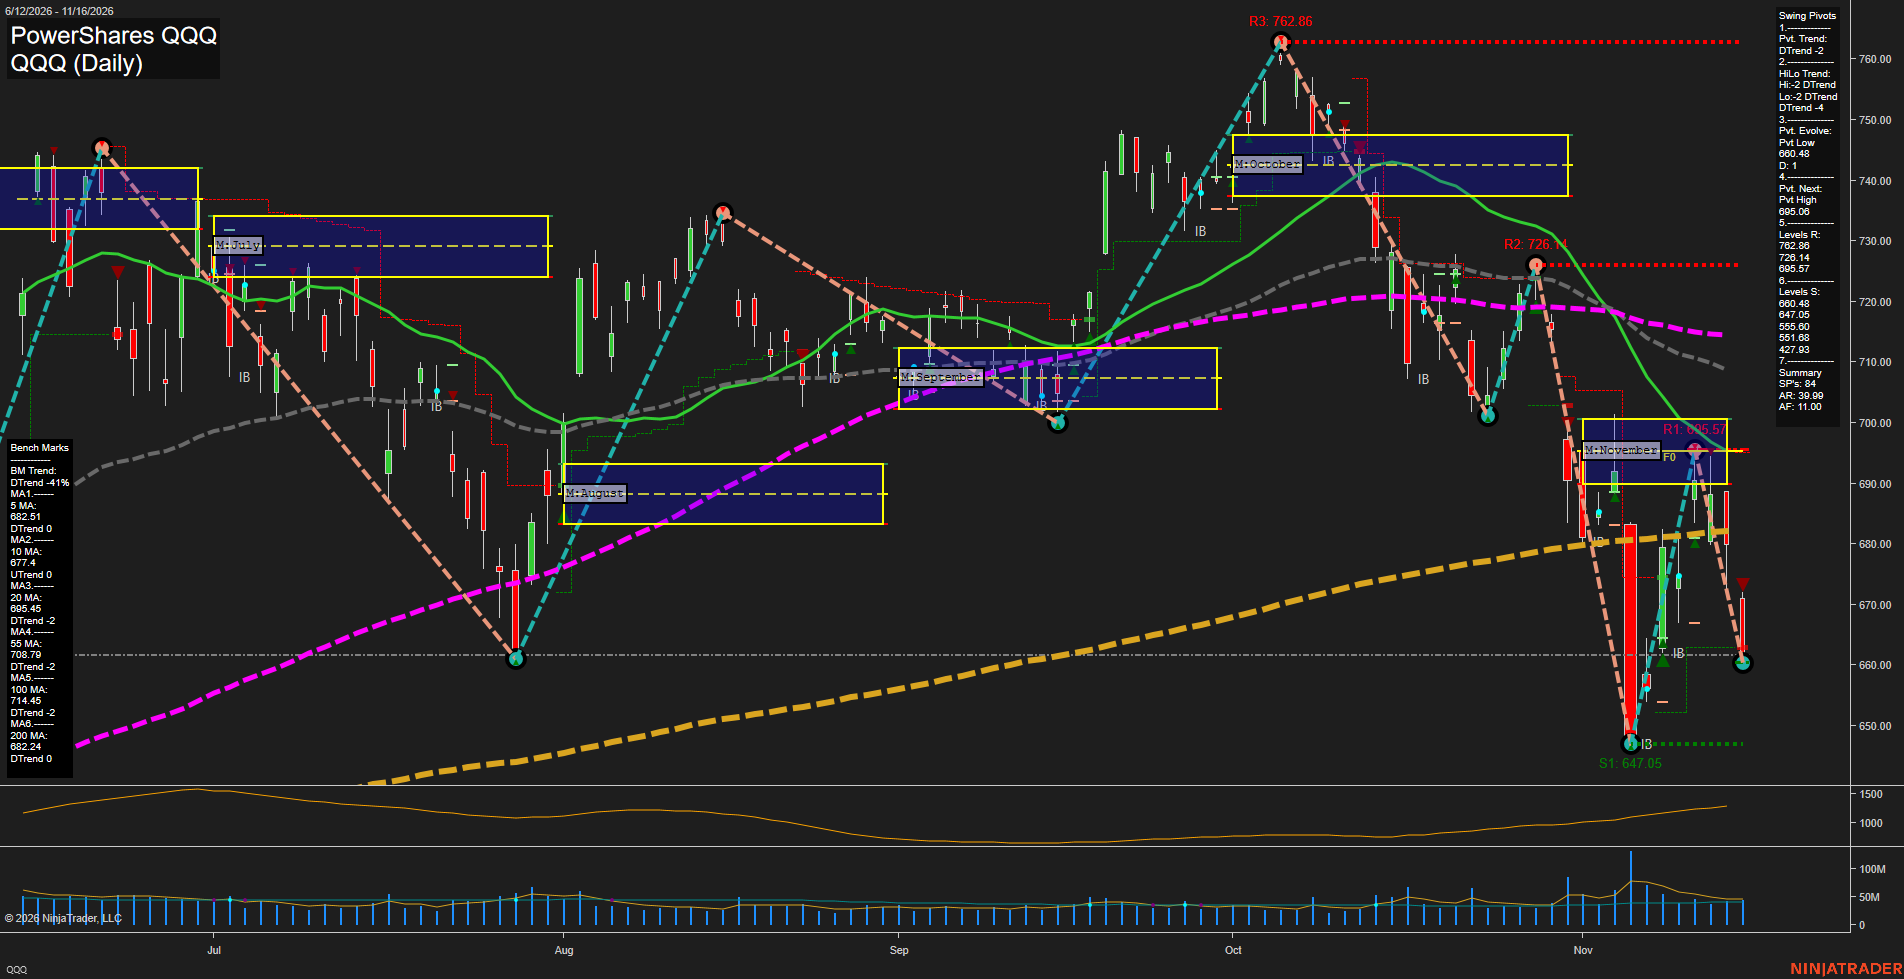
QQQ PowerShares QQQ Daily Chart Analysis — Pre-Open: 2026-Nov-17 07:11 CT
Price Action
- Last: Approximately 662,
- Bars: Large,
- Mom: Momentum fast.
WSFG Weekly
- Near-Term
- WSFG Current: NA%
- F0%/NTZ' Bias: Price Neutral,
- WSFG Trend: Neutral.
MSFG Month Nov
- Medium-Term
- MSFG Current: NA%
- F0%/NTZ' Bias: Price Neutral,
- MSFG Trend: Neutral.
YSFG Year 2026
- Far-Term
- YSFG Current: NA%
- F0%/NTZ' Bias: Price Neutral,
- YSFG Trend: Neutral.
Swing Pivots
- (Near-Term) 1. Pvt. Trend: DTrend,
- (Medium-Term) 2. HiLo Trend: DTrend,
- 3. Pvt. Evolve: Pvt low 660.48,
- 4. Pvt. Next: Pvt high 695.06,
- 5. Levels R: 762.86, 726.14, 695.57,
- 6. Levels S: 660.48, 647.05, 555.60, 551.68, 427.93.
Daily Benchmarks
- (Near-Term) 5 Day: 682.51 Down Trend,
- (Near-Term) 10 Day: 677.40 Down Trend,
- (Medium-Term) 20 Day: 695.45 Down Trend,
- (Medium-Term) 55 Day: 708.79 Down Trend,
- (Far-Term) 100 Day: 714.45 Down Trend,
- (Far-Term) 200 Day: 682.24 Down Trend.
Additional Metrics
- ATR: 733,
- VOLMA: 32709273.
Overall Rating
- Near-Term: Bearish,
- Medium-Term: Bearish,
- Far-Term: Bearish.
Key Insights Summary
From a futures swing trader’s perspective, QQQ reflects bearish Nasdaq-linked equity momentum, although these are ETF levels rather than executable futures prices. Successively lower swing highs at 762.86, 726.14 and 695.57 define the dominant downswing. The rebound from 647.05 failed near 695.57, followed by a sharp return toward evolving support at 660.48. That leaves a potential higher low above 647.05, but no confirmed bullish pivot reversal. Price is below all six benchmarks, with the 200-day benchmark near 682.24 also overhead. November’s monthly grid appears approximately 690–701, placing price below its neutral zone; consequently, the neutral grid entries above should be treated as placeholders rather than confirmation of neutral conditions. Weekly and yearly grid readings and the requested USAR signal states are not identifiable in this image. Large recent bars and the rising ATR plot indicate expanding daily volatility. The ATR and VOLMA numbers above reproduce the supplied template values, as exact current readings are not displayed clearly. No contemporaneous news catalyst or seasonal conclusion can be established from this chart alone.
Chart Analysis ATS AI Generated: 2026-11-17 07:11 for Informational use only, not trading advice. Terms and Risk Disclosure Copyright © 2026. Algo Trading Systems LLC.