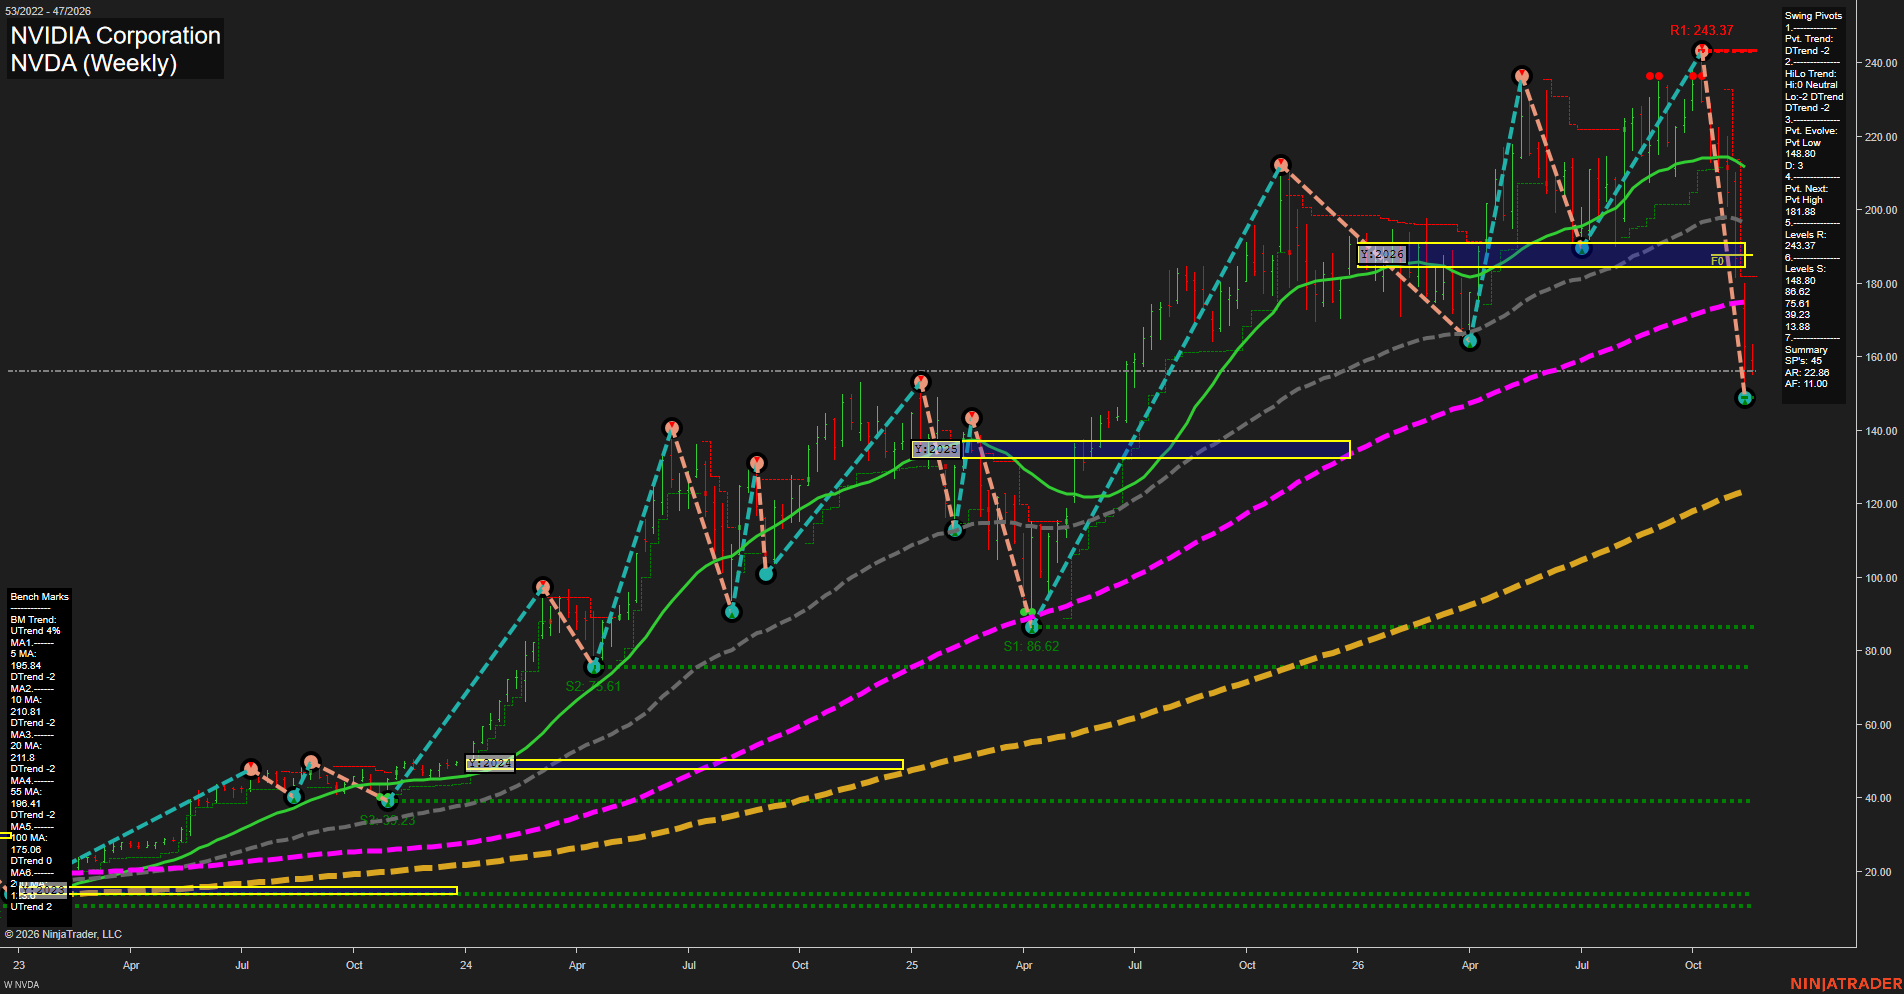
NVDA NVIDIA Corporation Weekly Chart Analysis — Pre-Open: 2026-Nov-17 07:11 CT
Price Action
- Last: Approximately 156,
- Bars: Large,
- Mom: Momentum fast to the downside.
WSFG Weekly
- Near-Term
- WSFG Current: NA%
- F0%/NTZ' Bias: Not available,
- WSFG Trend: Not available.
MSFG Month Nov
- Medium-Term
- MSFG Current: NA%
- F0%/NTZ' Bias: Not available,
- MSFG Trend: Not available.
YSFG Year 2026
- Far-Term
- YSFG Current: NA%
- F0%/NTZ' Bias: Price below F0% and NTZ,
- YSFG Trend: Bearish.
Swing Pivots
- (Near-Term) 1. Pvt. Trend: DTrend,
- (Medium-Term) 2. HiLo Trend: DTrend,
- 3. Pvt. Evolve: Pvt low 148.80,
- 4. Pvt. Next: Pvt high 181.88,
- 5. Levels R: 243.37,
- 6. Levels S: 148.80, 86.62, 75.61, 39.23, 13.88.
Weekly Benchmarks
- (Near-Term) 5 Week: 195.84 Down Trend,
- (Near-Term) 10 Week: 210.81 Down Trend,
- (Medium-Term) 20 Week: 211.8 Down Trend,
- (Medium-Term) 55 Week: 196.41 Down Trend,
- (Far-Term) 100 Week: 175.06 Down Trend,
- (Far-Term) 200 Week: Approximately 123 Up Trend.
Overall Rating
- Near-Term: Bearish,
- Medium-Term: Bearish,
- Far-Term: Bearish.
Key Insights Summary
From a futures swing trader’s perspective, downside range expansion and a deteriorating pivot structure dominate this weekly equity chart. The decline from 243.37 to the evolving 148.80 low is approximately 39%, with the latest price near 156 showing only a modest rebound from that low. Price is below the five benchmarks from 5 through 100 weeks and beneath the yearly neutral zone around 185–191, indicating weakness across several swing horizons. The 181.88 next-pivot threshold marks the chart’s defined potential transition to a new upward pivot, rather than a confirmed reversal. Longer-term structure is mixed beneath the bearish rating because the rising 200-week benchmark remains below price. Weekly and monthly grids, the named recent trade signals, and news catalysts are not visible, so those inputs cannot be verified. This is NVDA equity price action, not a futures contract chart; contract-specific volume, positioning, and term structure are not provided.
Chart Analysis ATS AI Generated: 2026-11-17 07:11 for Informational use only, not trading advice. Terms and Risk Disclosure Copyright © 2026. Algo Trading Systems LLC.