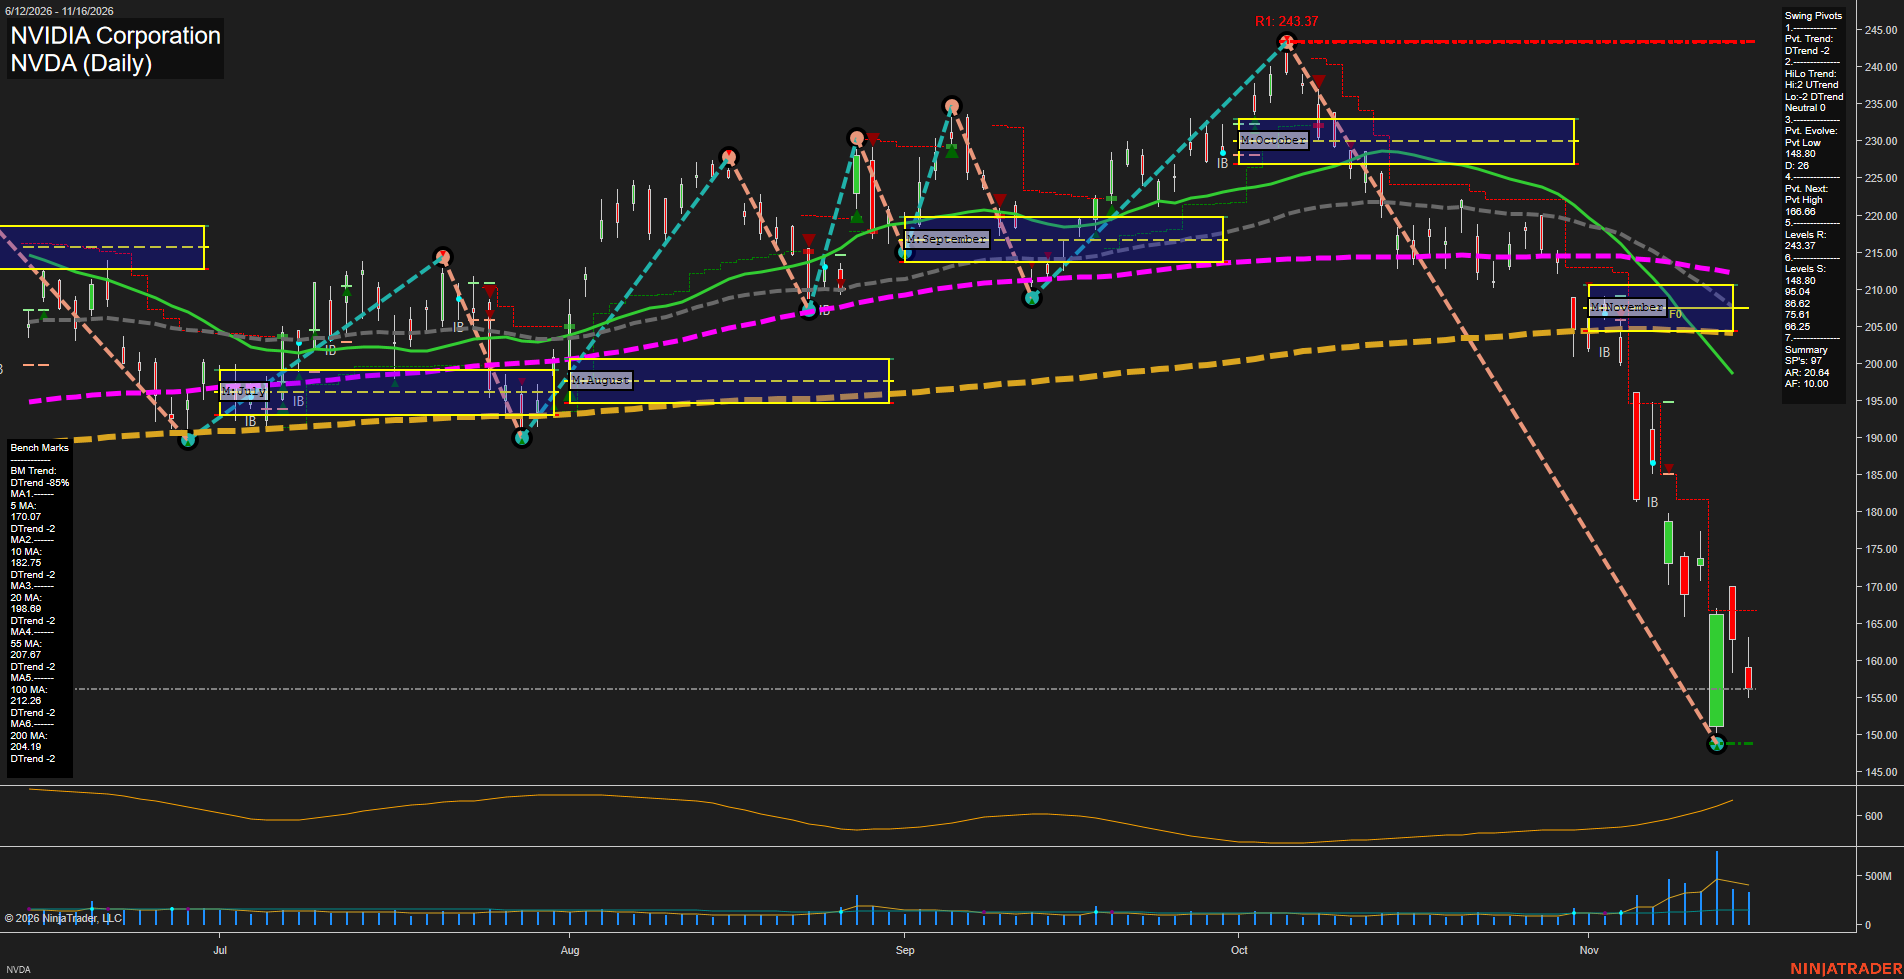
NVDA NVIDIA Corporation Daily Chart Analysis — Pre-Open: 2026-Nov-17 07:11 CT
Price Action
- Last: approximately 156.00,
- Bars: Large,
- Mom: Momentum fast.
WSFG Weekly
- Near-Term
- WSFG Current: NA%
- F0%/NTZ' Bias: Price Neutral,
- WSFG Trend: Neutral.
MSFG Month Nov
- Medium-Term
- MSFG Current: NA%
- F0%/NTZ' Bias: Price Bearish,
- MSFG Trend: Bearish.
YSFG Year 2026
- Far-Term
- YSFG Current: NA%
- F0%/NTZ' Bias: Price Neutral,
- YSFG Trend: Neutral.
Swing Pivots
- (Near-Term) 1. Pvt. Trend: DTrend,
- (Medium-Term) 2. HiLo Trend: Neutral,
- 3. Pvt. Evolve: Pvt low 148.80,
- 4. Pvt. Next: Pvt high 186.66,
- 5. Levels R: 243.37,
- 6. Levels S: 148.80, 95.04, 88.62, 75.61, 68.25.
Daily Benchmarks
- (Near-Term) 5 Day: 170.07 Down Trend,
- (Near-Term) 10 Day: 182.75 Down Trend,
- (Medium-Term) 20 Day: 198.89 Down Trend,
- (Medium-Term) 55 Day: 207.67 Down Trend,
- (Far-Term) 100 Day: 212.26 Down Trend,
- (Far-Term) 200 Day: 204.19 Down Trend.
Additional Metrics
- ATR: 599,
- VOLMA: 346637249.
Overall Rating
- Near-Term: Bearish,
- Medium-Term: Bearish,
- Far-Term: Bearish.
Key Insights Summary
From a futures swing-trading perspective, NVDA shows a fast downside expansion rather than an ordinary pullback. Price has declined approximately 36% from the 243.37 swing high and remains below all six falling benchmarks. The November monthly neutral zone, approximately 204–211, is now overhead following a decisive breakdown. The rebound from 148.80 has lost momentum, leaving that evolving pivot low as the nearest displayed support. Medium-term pivot structure is mixed, with rising highs but falling lows, although benchmark alignment and price momentum remain bearish. Expanding volume and rising ATR indicate an elevated-volatility liquidation regime. Weekly and yearly grids and the named trade-signal series are not displayed; their neutral entries do not establish confirmed neutral trends. This is an equity chart, so futures-specific positioning, basis and contract-flow conclusions cannot be established. News and seasonal explanations are not verifiable from the image.
Chart Analysis ATS AI Generated: 2026-11-17 07:11 for Informational use only, not trading advice. Terms and Risk Disclosure Copyright © 2026. Algo Trading Systems LLC.