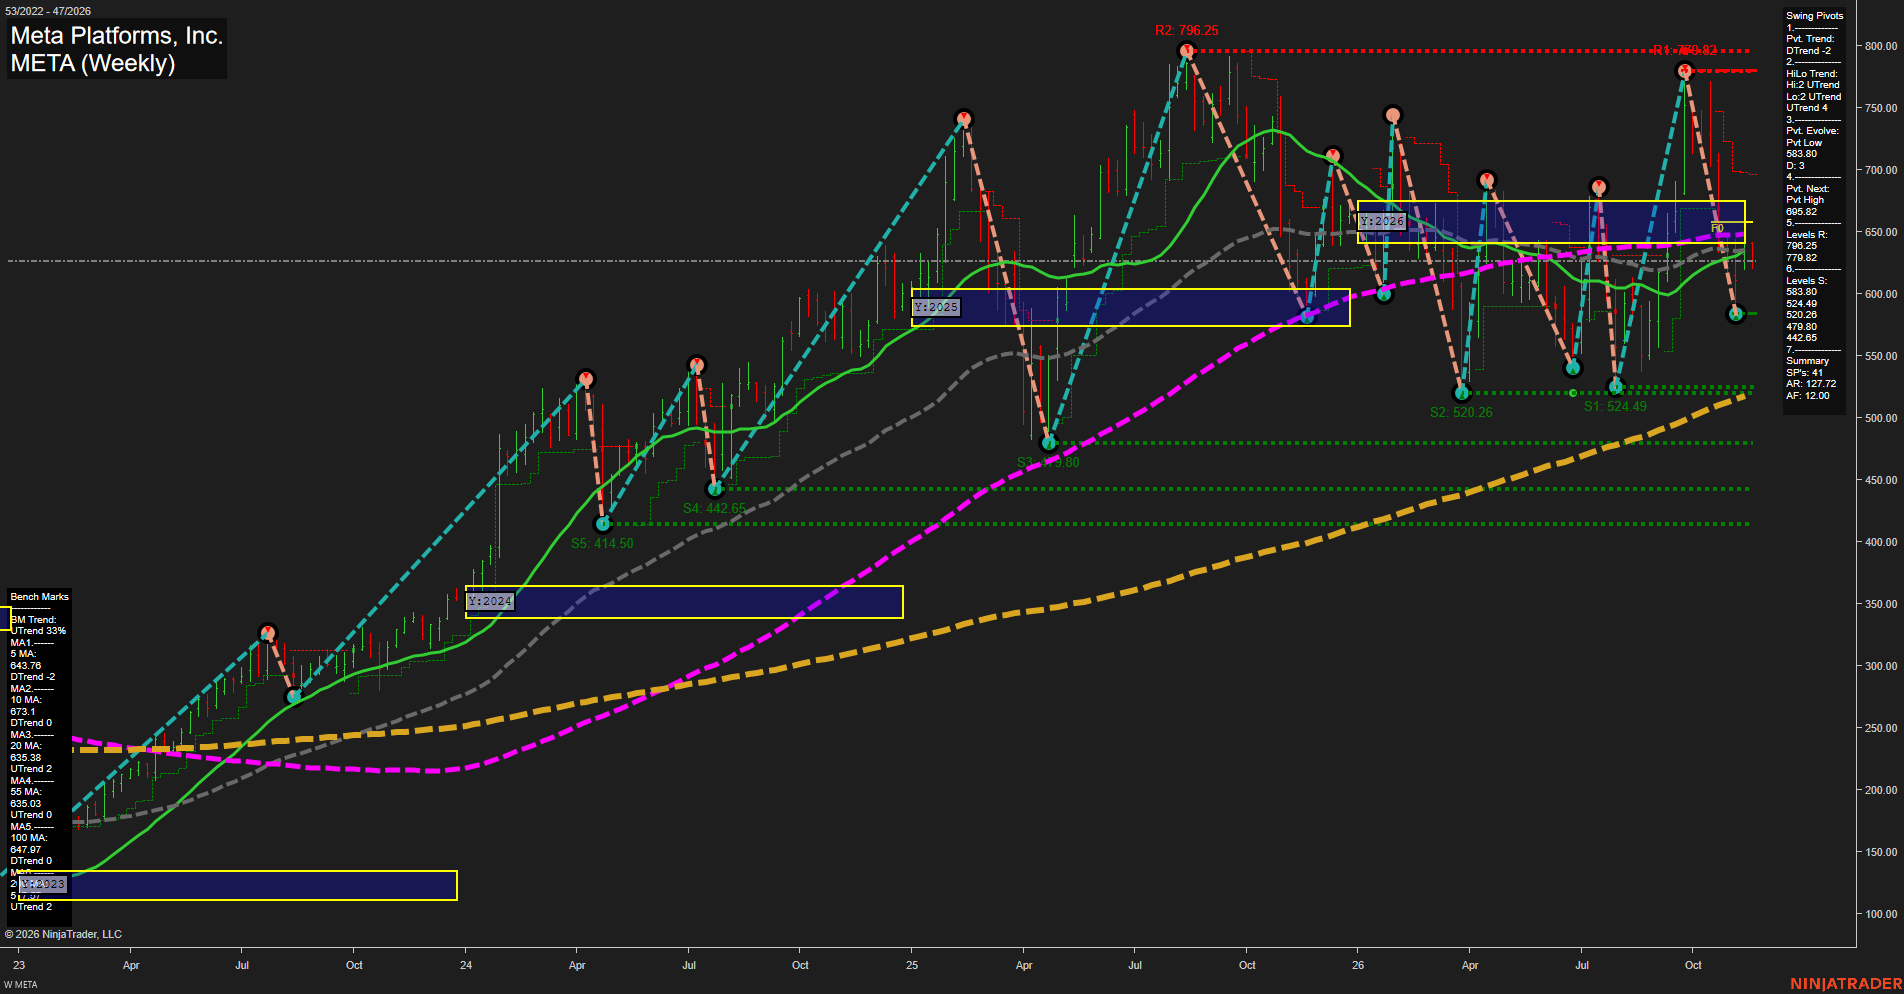
META Meta Platforms; Inc. Weekly Chart Analysis — Pre-Open: 2026-Nov-17 07:09 CT
Price Action
- Last: approximately 627,
- Bars: Large,
- Mom: Momentum fast.
WSFG Weekly
- Near-Term
- WSFG Current: NA%
- F0%/NTZ' Bias: Price Neutral,
- WSFG Trend: Neutral.
MSFG Month Nov
- Medium-Term
- MSFG Current: NA%
- F0%/NTZ' Bias: Price Neutral,
- MSFG Trend: Neutral.
YSFG Year 2026
- Far-Term
- YSFG Current: NA%
- F0%/NTZ' Bias: Price Neutral,
- YSFG Trend: Neutral.
Swing Pivots
- (Near-Term) 1. Pvt. Trend: DTrend,
- (Medium-Term) 2. HiLo Trend: UTrend,
- 3. Pvt. Evolve: Pvt low 583.80,
- 4. Pvt. Next: Pvt high 695.82,
- 5. Levels R: 796.25, 779.82,
- 6. Levels S: 583.80, 524.49, 520.26, 479.80, 442.65.
Weekly Benchmarks
- (Near-Term) 5 Week: 643.76 Down Trend,
- (Near-Term) 10 Week: 673.10 Down Trend,
- (Medium-Term) 20 Week: 635.38 Up Trend,
- (Medium-Term) 55 Week: 635.03 Up Trend,
- (Far-Term) 100 Week: 647.97 Down Trend,
- (Far-Term) 200 Week: approximately 520 Up Trend.
Overall Rating
- Near-Term: Bearish,
- Medium-Term: Neutral,
- Far-Term: Neutral.
Key Insights Summary
From a futures swing trader’s perspective, META shows a fast downside swing within a broader, increasingly choppy consolidation rather than a clean trend continuation. The decline from 779.82 established an evolving low at 583.80; the subsequent rebound remains below the approximately 635–648 benchmark cluster and declining near-term averages. Near-term pivot direction is bearish, while the medium-term higher-high/higher-low summary remains bullish, creating a trend-versus-countertrend conflict. The rising 200-week benchmark preserves the longer-term underlying advance, but the declining 100-week average makes the far-term picture mixed. The 695.82 reading is the next pivot-reversal threshold, distinct from established resistance at 779.82 and 796.25. Weekly and monthly grids and the named recent trade signals are not visible, so their directional confirmation is unavailable; their neutral template entries do not establish observed neutrality. Although the yearly grid template is neutral, visible price is below its yellow neutral zone. The 200-week value is approximate because its summary is obscured. No news or seasonal catalyst is established by this chart.
Chart Analysis ATS AI Generated: 2026-11-17 07:09 for Informational use only, not trading advice. Terms and Risk Disclosure Copyright © 2026. Algo Trading Systems LLC.