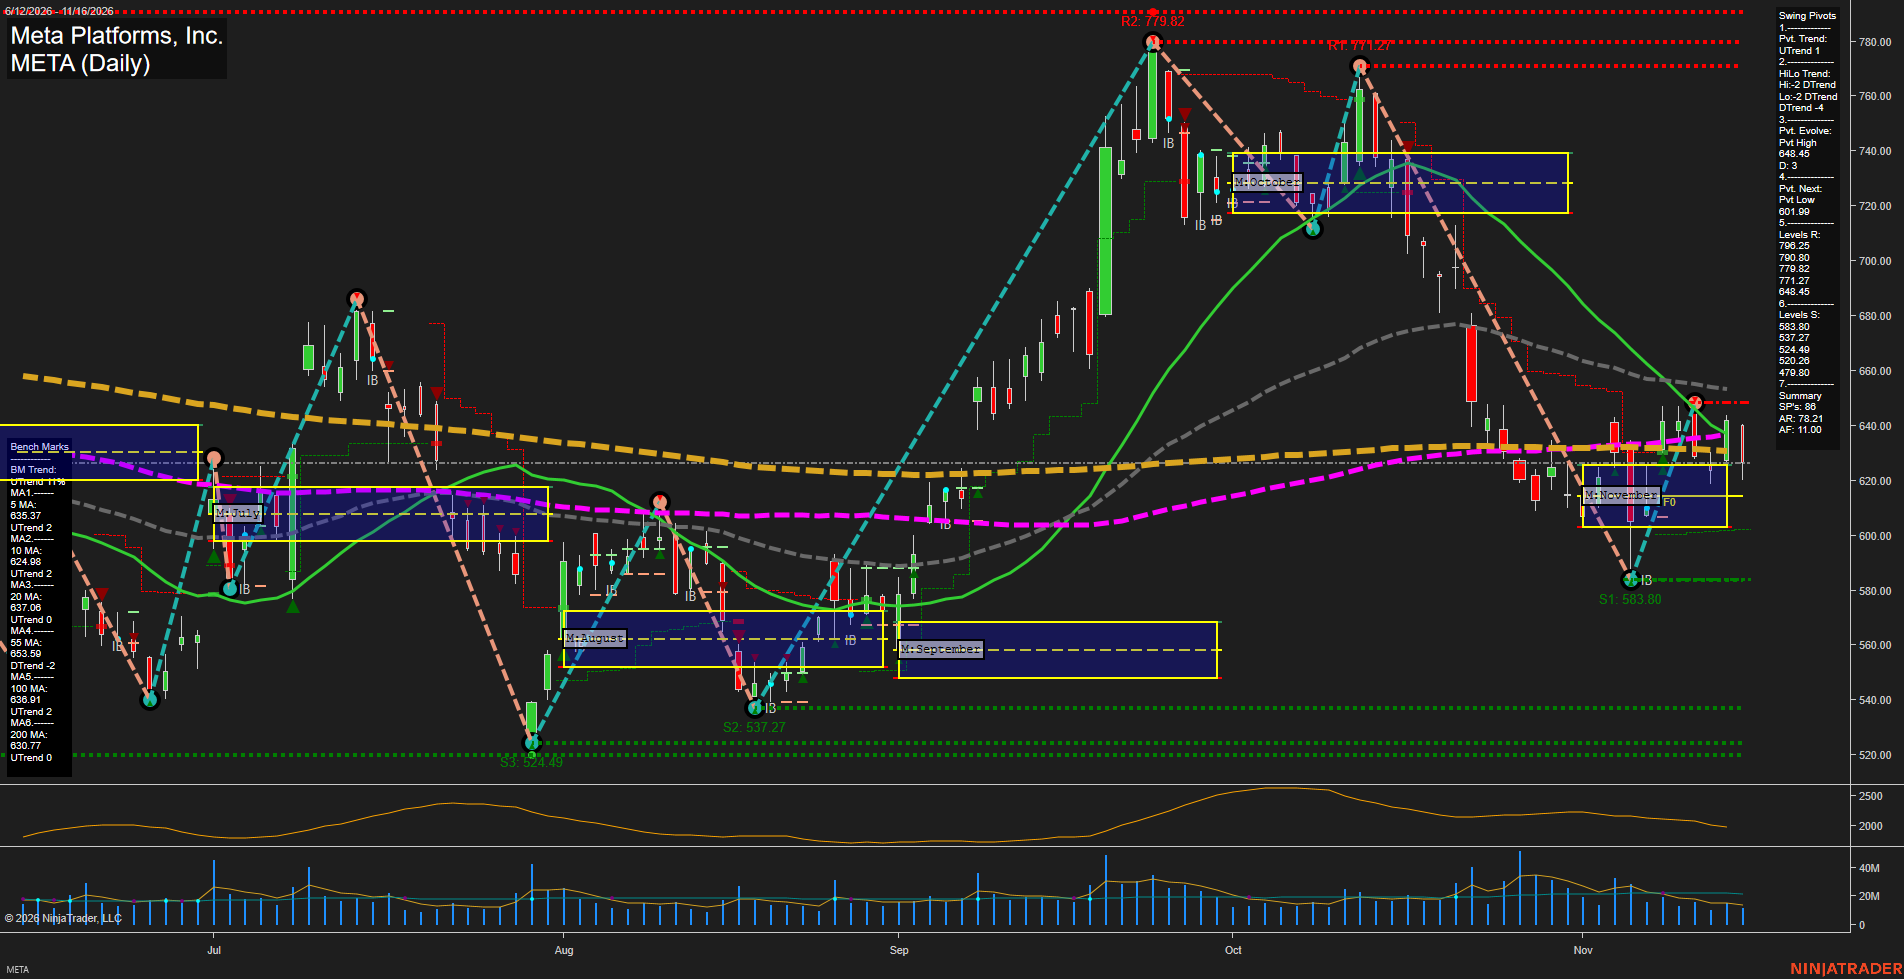
META Meta Platforms; Inc. Daily Chart Analysis — Pre-Open: 2026-Nov-17 07:08 CT
Price Action
- Last: approximately 627,
- Bars: Medium,
- Mom: Momentum slow.
WSFG Weekly
- Near-Term
- WSFG Current: NA%
- F0%/NTZ' Bias: Price Neutral,
- WSFG Trend: Neutral.
MSFG Month Nov
- Medium-Term
- MSFG Current: NA%
- F0%/NTZ' Bias: Price Neutral,
- MSFG Trend: Neutral.
YSFG Year 2026
- Far-Term
- YSFG Current: NA%
- F0%/NTZ' Bias: Price Neutral,
- YSFG Trend: Neutral.
Swing Pivots
- (Near-Term) 1. Pvt. Trend: UTrend,
- (Medium-Term) 2. HiLo Trend: DTrend,
- 3. Pvt. Evolve: Pvt high 648.45,
- 4. Pvt. Next: Pvt low 601.99,
- 5. Levels R: 796.25, 790.80, 779.82, 771.27, 648.45,
- 6. Levels S: 583.80, 537.27, 524.49, 520.26, 479.80.
Daily Benchmarks
- (Near-Term) 5 Day: 635.37 Up Trend,
- (Near-Term) 10 Day: 624.98 Up Trend,
- (Medium-Term) 20 Day: 637.06 Up Trend,
- (Medium-Term) 55 Day: 653.59 Down Trend,
- (Far-Term) 100 Day: 636.91 Up Trend,
- (Far-Term) 200 Day: 630.77 Up Trend.
Additional Metrics
- ATR: 2162,
- VOLMA: 26211336.
Overall Rating
- Near-Term: Bullish,
- Medium-Term: Bearish,
- Far-Term: Neutral.
Key Insights Summary
From a futures swing-trading perspective, META shows a near-term countertrend recovery within a medium-term lower-high/lower-low structure. The rebound from 583.80 reached 648.45 before retracing toward 627, leaving price above the rising 10-day benchmark but below the 5-, 20-, 100- and 200-day benchmarks. Near-term bullish structure is therefore losing momentum rather than confirming a sustained trend reversal. The 630.77–637.06 benchmark cluster defines overhead congestion, with additional resistance at 648.45 and 653.59. The next pivot-low reversal threshold is 601.99, distinct from established swing support at 583.80. Rising long-term averages contrast with price beneath them, producing a neutral far-term assessment. Recent volume has contracted, suggesting limited participation in the latest recovery. Weekly and yearly grids and named trade-signal readings are unavailable; no news or seasonal catalyst can be established from this chart.
Chart Analysis ATS AI Generated: 2026-11-17 07:09 for Informational use only, not trading advice. Terms and Risk Disclosure Copyright © 2026. Algo Trading Systems LLC.