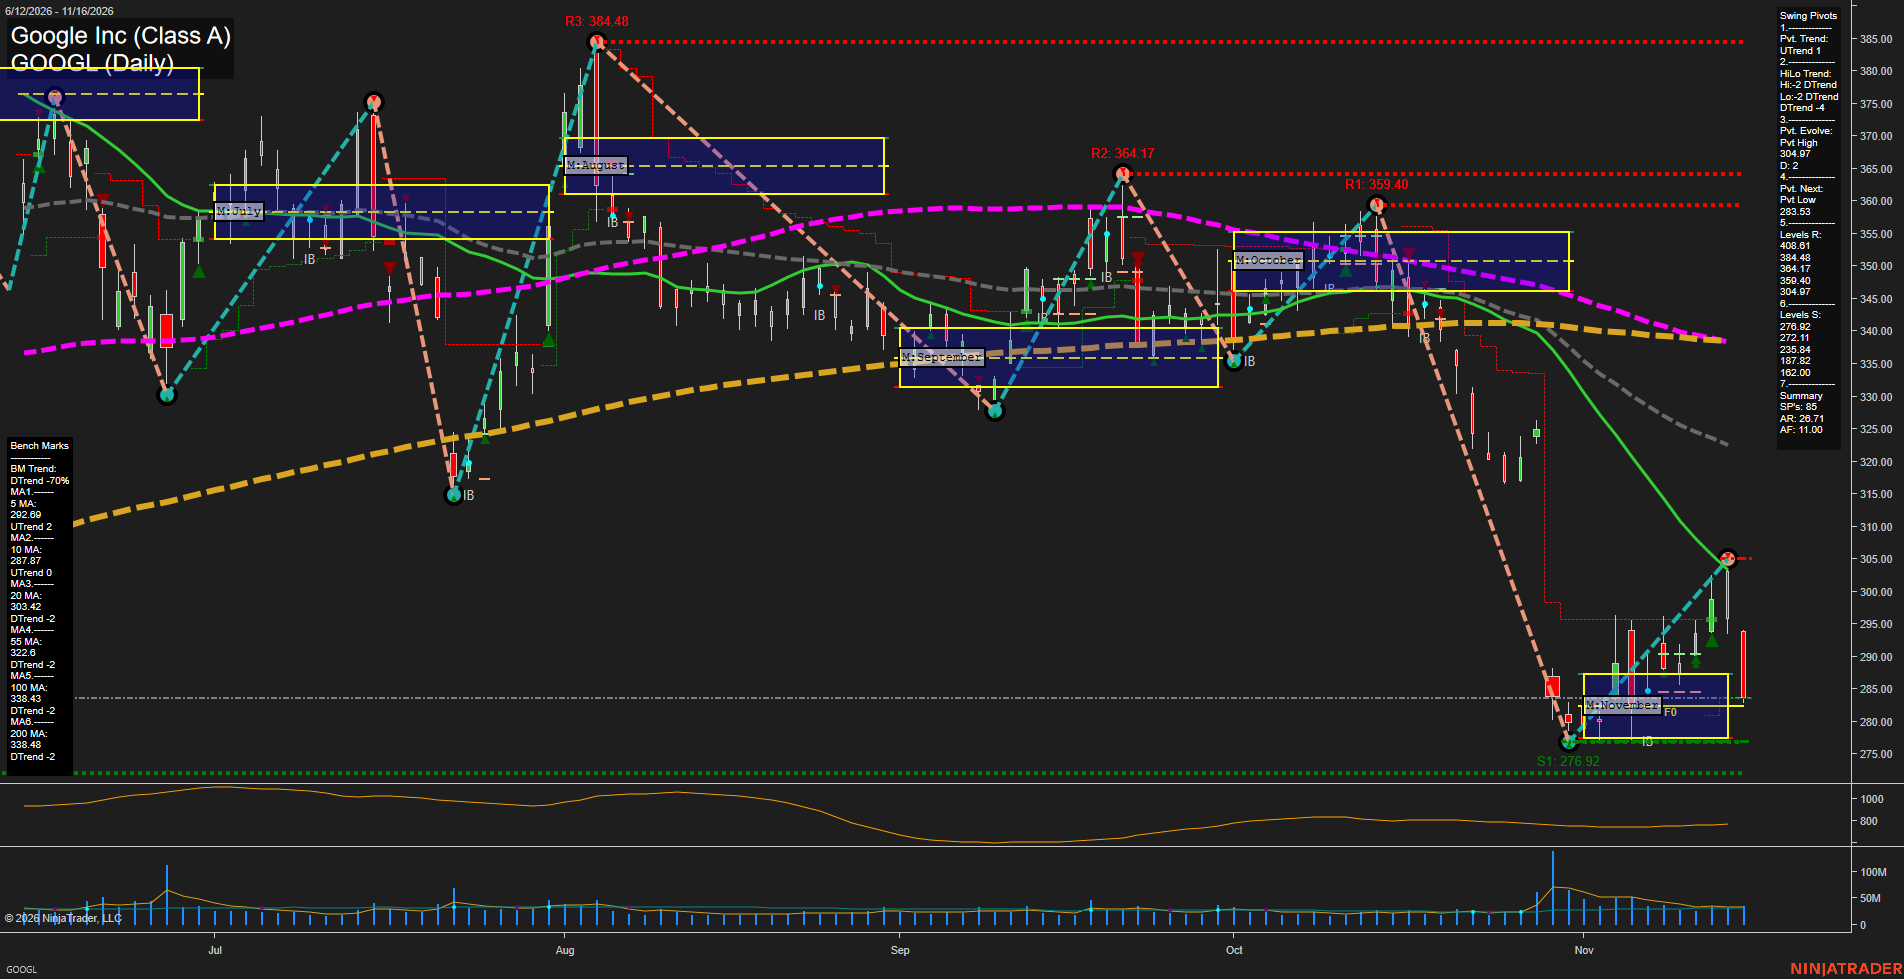
GOOGL Google Inc (Class A) Daily Chart Analysis — Pre-Open: 2026-Nov-17 07:08 CT
Price Action
- Last: Approximately 283.53,
- Bars: Large,
- Mom: Momentum fast.
WSFG Weekly
- Near-Term
- WSFG Current: NA%
- F0%/NTZ' Bias: Price Neutral,
- WSFG Trend: Neutral.
MSFG Month Nov
- Medium-Term
- MSFG Current: NA%
- F0%/NTZ' Bias: Price Neutral,
- MSFG Trend: Neutral.
YSFG Year 2026
- Far-Term
- YSFG Current: NA%
- F0%/NTZ' Bias: Price Neutral,
- YSFG Trend: Neutral.
Swing Pivots
- (Near-Term) 1. Pvt. Trend: UTrend,
- (Medium-Term) 2. HiLo Trend: DTrend,
- 3. Pvt. Evolve: Pvt high 304.97,
- 4. Pvt. Next: Pvt low 283.53,
- 5. Levels R: 408.61, 384.48, 364.17, 359.40, 304.97,
- 6. Levels S: 276.92, 272.11, 235.84, 187.82, 162.00.
Daily Benchmarks
- (Near-Term) 5 Day: 292.69 Up Trend,
- (Near-Term) 10 Day: 287.87 Up Trend,
- (Medium-Term) 20 Day: 303.42 Down Trend,
- (Medium-Term) 55 Day: 322.60 Down Trend,
- (Far-Term) 100 Day: 338.43 Down Trend,
- (Far-Term) 200 Day: 338.48 Down Trend.
Additional Metrics
- ATR: 420,
- VOLMA: 25379774.
Overall Rating
- Near-Term: Bullish,
- Medium-Term: Bearish,
- Far-Term: Bearish.
Key Insights Summary
From a futures swing trader’s perspective, this equity chart shows a countertrend rebound within a broader declining structure, rather than a confirmed trend reversal. The rebound from 276.92 to 304.97 has suffered a sharp bearish rejection, returning price to November’s neutral zone near 283.53. The near-term bullish rating reflects the majority of reported pivot and short-average trend metrics, but price has already fallen below both short averages, exposing a significant divergence between those metrics and current momentum. Lower swing highs and declining 20-, 55-, 100- and 200-day benchmarks reinforce the medium- and far-term bearish readings. The 304.97 pivot defines nearby overhead resistance; 276.92 and 272.11 remain the closest listed supports. Weekly and yearly grids, named USAR signals, and news or seasonal drivers are not verifiable from this image. ATR and VOLMA above reproduce the supplied template values rather than independently verified panel readings.
Chart Analysis ATS AI Generated: 2026-11-17 07:08 for Informational use only, not trading advice. Terms and Risk Disclosure Copyright © 2026. Algo Trading Systems LLC.