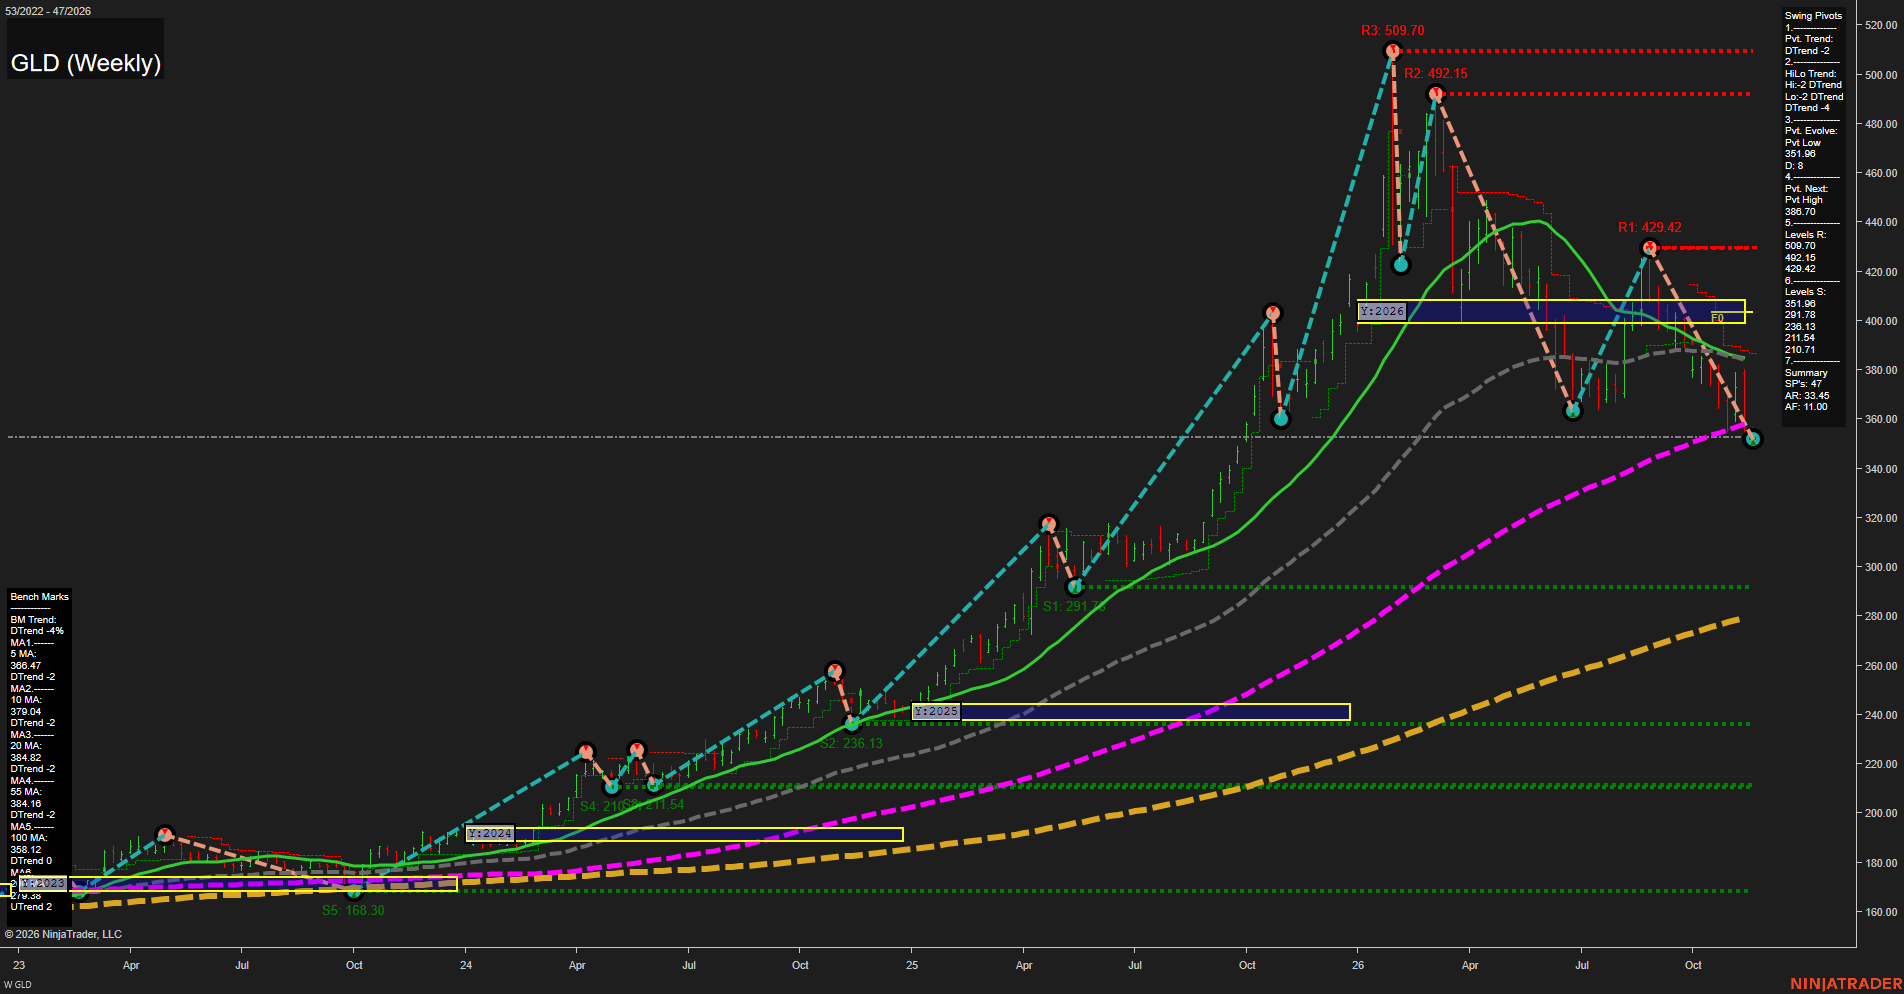
GLD SPDR Gold Shares Weekly Chart Analysis — Pre-Open: 2026-Nov-17 07:08 CT
Price Action
- Last: Approximately 351.96,
- Bars: Large,
- Mom: Momentum fast to the downside.
WSFG Weekly
- Near-Term
- WSFG Current: NA%
- F0%/NTZ' Bias: Price Neutral,
- WSFG Trend: Neutral.
MSFG Month Nov
- Medium-Term
- MSFG Current: NA%
- F0%/NTZ' Bias: Price Neutral,
- MSFG Trend: Neutral.
YSFG Year 2026
- Far-Term
- YSFG Current: NA%
- F0%/NTZ' Bias: Price below F0% and NTZ,
- YSFG Trend: Bearish.
Swing Pivots
- (Near-Term) 1. Pvt. Trend: DTrend,
- (Medium-Term) 2. HiLo Trend: DTrend,
- 3. Pvt. Evolve: Pvt low 351.96,
- 4. Pvt. Next: Pvt high 386.70,
- 5. Levels R: 509.70, 492.15, 429.42,
- 6. Levels S: 351.96, 291.78, 236.13, 211.54, 210.71.
Weekly Benchmarks
- (Near-Term) 5 Week: 366.47 Down Trend,
- (Near-Term) 10 Week: 379.04 Down Trend,
- (Medium-Term) 20 Week: 384.82 Down Trend,
- (Medium-Term) 55 Week: 384.16 Down Trend,
- (Far-Term) 100 Week: 358.12 Down Trend,
- (Far-Term) 200 Week: Approximately 278.4 Up Trend.
Overall Rating
- Near-Term: Bearish,
- Medium-Term: Bearish,
- Far-Term: Bearish.
Key Insights Summary
From a futures swing trader’s perspective, GLD shows an established corrective downswing rather than a confirmed bullish reversal. Successively lower resistance pivots at 509.70, 492.15 and 429.42 accompany lower lows, while price sits below the 5-, 10-, 20-, 55- and 100-week benchmarks. The latest decline has undercut the prior swing-low area near 360 and reached the evolving 351.96 pivot, approximately 31% below the peak. The 386.70 next-pivot threshold is a structural reversal reference, not a confirmed reversal. Overhead benchmark congestion around 379–385 and the yearly neutral zone around 400–409 reinforce the bearish technical backdrop. Far-term conditions are bearish, although the rising 200-week average indicates that the multi-year advance has not been completely unwound. Weekly and monthly fib grids and the requested recent-signal studies are not displayed; their neutral entries are placeholders rather than verified signals. News and seasonal drivers cannot be established from this chart, and GLD price levels are not directly interchangeable with gold futures prices.
Chart Analysis ATS AI Generated: 2026-11-17 07:08 for Informational use only, not trading advice. Terms and Risk Disclosure Copyright © 2026. Algo Trading Systems LLC.