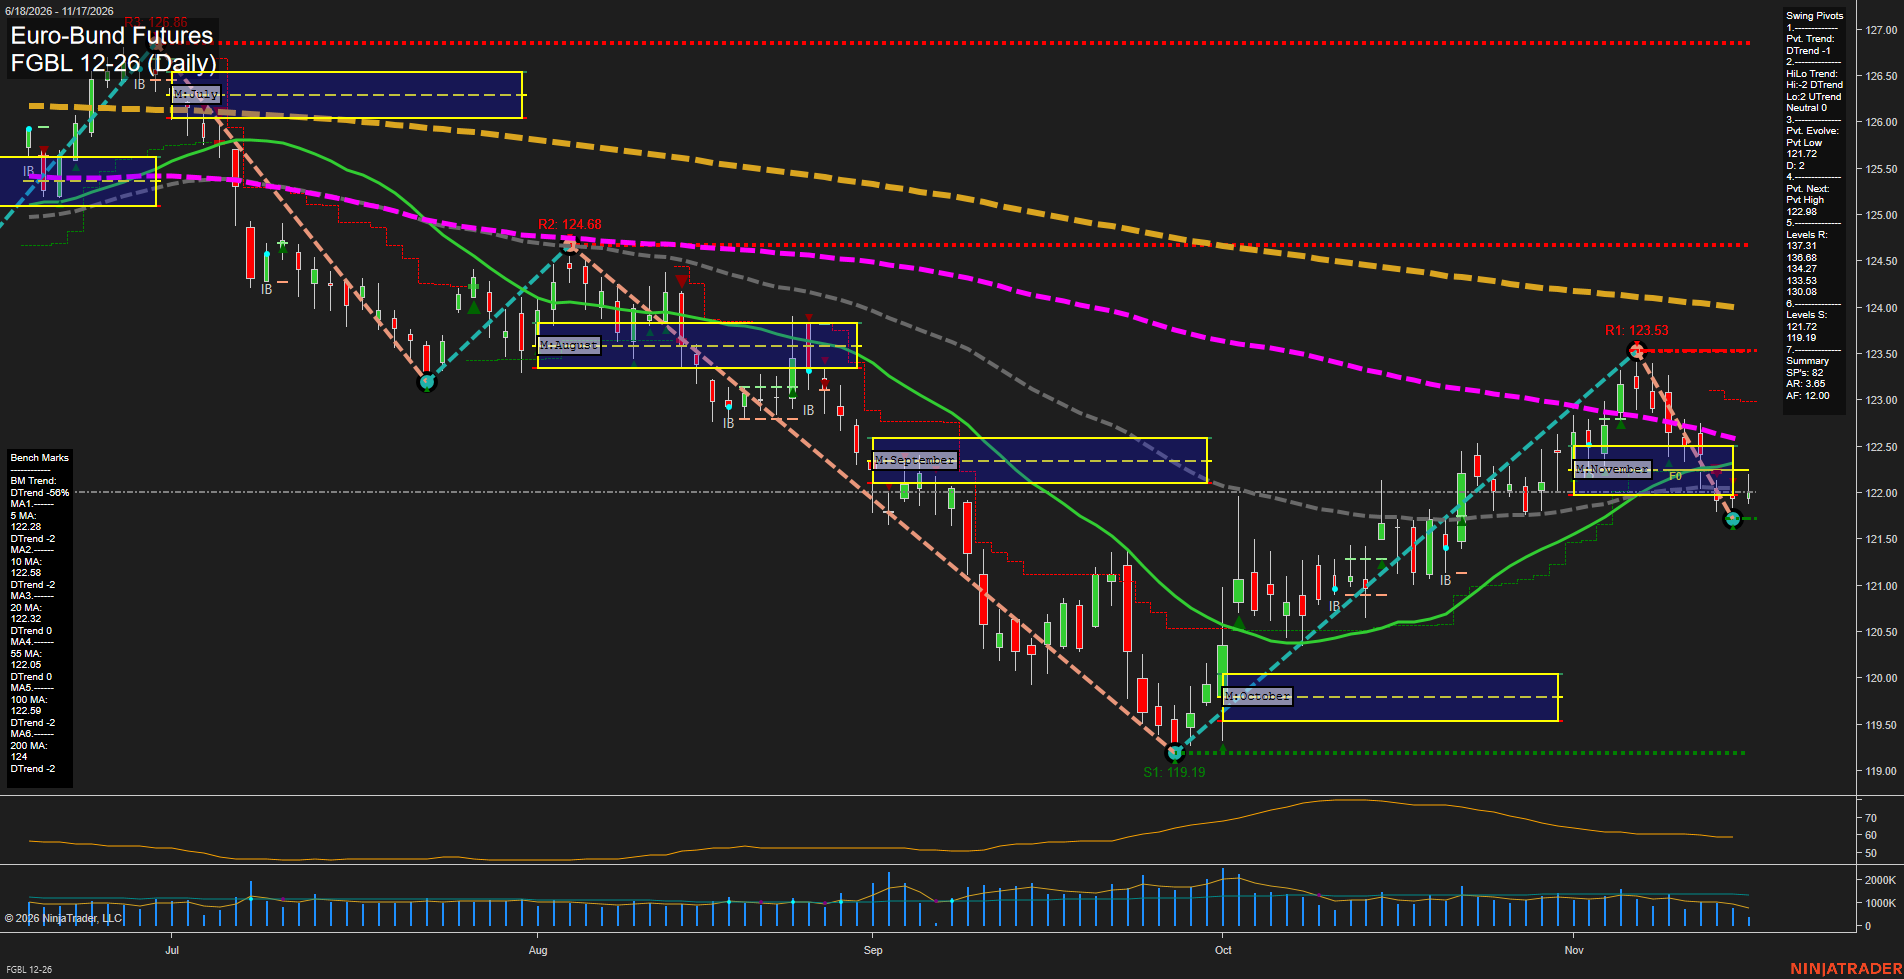
FGBL Euro-Bund Futures Daily Chart Analysis — Pre-Open: 2026-Nov-17 07:06 CT
Price Action
- Last: Approximately 122.01,
- Bars: Small,
- Mom: Momentum slow.
WSFG Weekly
- Near-Term
- WSFG Current: 1%
- F0%/NTZ' Bias: Price Above,
- WSFG Trend: Up.
MSFG Month Nov
- Medium-Term
- MSFG Current: -10%
- F0%/NTZ' Bias: Price Below,
- MSFG Trend: Down.
YSFG Year 2026
- Far-Term
- YSFG Current: -32%
- F0%/NTZ' Bias: Price Below,
- YSFG Trend: Down.
Swing Pivots
- (Near-Term) 1. Pvt. Trend: DTrend,
- (Medium-Term) 2. HiLo Trend: Neutral,
- 3. Pvt. Evolve: Pvt low 121.72,
- 4. Pvt. Next: Pvt high 122.98,
- 5. Levels R: 137.31, 136.68, 134.27, 133.53, 130.08,
- 6. Levels S: 121.72, 119.19.
Daily Benchmarks
- (Near-Term) 5 Day: 122.28 Down Trend,
- (Near-Term) 10 Day: 122.58 Down Trend,
- (Medium-Term) 20 Day: 122.32 Down Trend,
- (Medium-Term) 55 Day: 122.05 Down Trend,
- (Far-Term) 100 Day: 122.59 Down Trend,
- (Far-Term) 200 Day: 124.00 Down Trend.
Additional Metrics
Recent Trade Signals
- 17 Nov 2026: Long FGBL 12-26 @ 122.16 Signals.USAR-WSFG
- 13 Nov 2026: Short FGBL 12-26 @ 121.93 Signals.USAR-MSFG
- 10 Nov 2026: Short FGBL 12-26 @ 122.68 Signals.USAR.TR120
Overall Rating
- Near-Term: Bearish,
- Medium-Term: Bearish,
- Far-Term: Bearish.
Key Insights Summary
The October recovery from 119.19 stalled at 123.53, followed by a pullback to an evolving 121.72 pivot low. Smaller recent candles indicate slowing downside momentum, but price remains below all six benchmarks and the monthly neutral zone. The weekly uptrend and latest weekly long signal describe a countertrend bounce within broader bearish conditions, rather than a confirmed reversal. Medium-term pivot structure is mixed, with falling highs but rising lows; the summary explicitly labels this neutral. The 20-day and 55-day benchmarks retain downtrend labels with zero trend scores, suggesting flattening. Nearby overhead benchmarks cluster at 122.05–122.59, while the next opposite-pivot threshold is 122.98. Visible chart resistance is 123.53, 124.68 and 126.86; the much higher resistance values reported above reproduce the separate summary listing. ATR has eased from its October peak, consistent with contracting volatility. No news, seasonal catalyst or far-term TR720 signal is supplied, so those factors cannot be independently assessed.
Chart Analysis ATS AI Generated: 2026-11-17 07:07 for Informational use only, not trading advice. Terms and Risk Disclosure Copyright © 2026. Algo Trading Systems LLC.