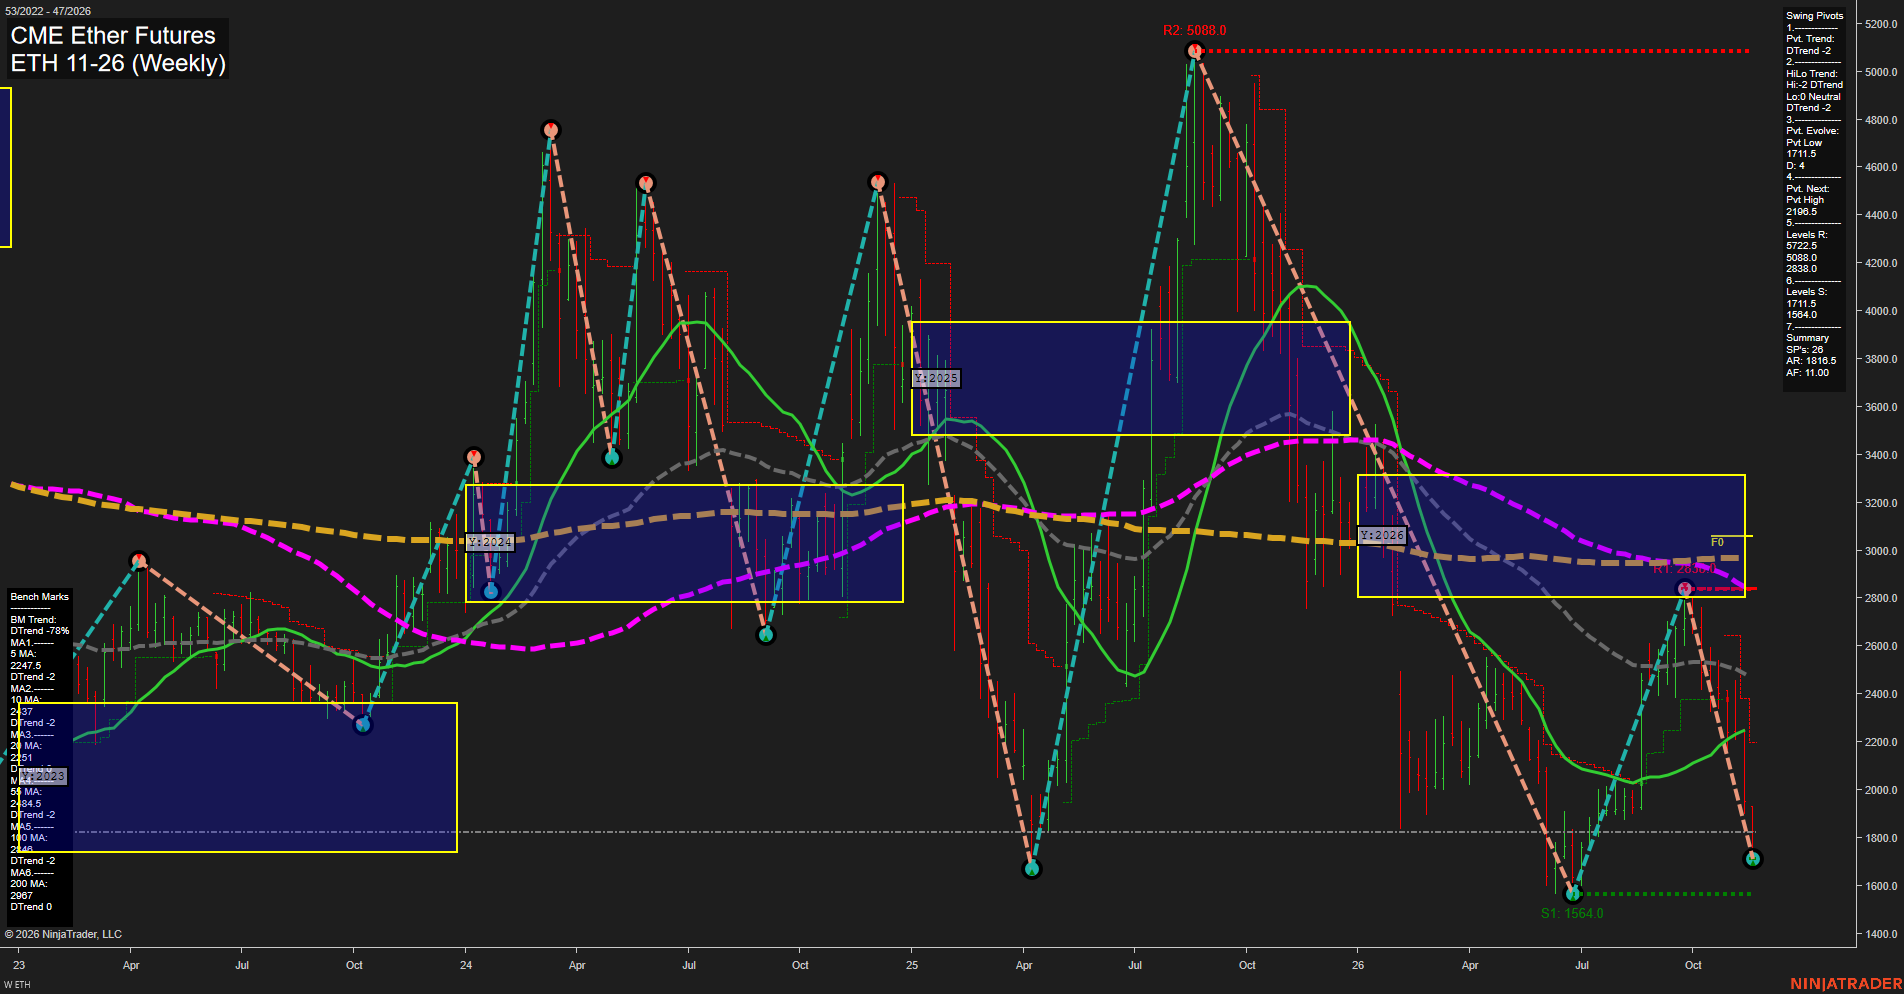
ETH CME Ether Futures Weekly Chart Analysis — Pre-Open: 2026-Nov-17 07:05 CT
Price Action
- Last: Approximately 1825,
- Bars: Large,
- Mom: Momentum fast.
WSFG Weekly
- Near-Term
- WSFG Current: 4%
- F0%/NTZ' Bias: Price Above,
- WSFG Trend: Up.
MSFG Month Nov
- Medium-Term
- MSFG Current: -73%
- F0%/NTZ' Bias: Price Below,
- MSFG Trend: Down.
YSFG Year 2026
- Far-Term
- YSFG Current: -48%
- F0%/NTZ' Bias: Price Below,
- YSFG Trend: Down.
Swing Pivots
- (Near-Term) 1. Pvt. Trend: DTrend,
- (Medium-Term) 2. HiLo Trend: DTrend,
- 3. Pvt. Evolve: Pvt low 1711.5,
- 4. Pvt. Next: Pvt high 2196.5,
- 5. Levels R: 5722.5, 5088.0, 2838.0,
- 6. Levels S: 1711.5, 1564.0.
Weekly Benchmarks
- (Near-Term) 5 Week: 2247.5 Down Trend,
- (Near-Term) 10 Week: Approximately 2337 Down Trend,
- (Medium-Term) 20 Week: 2251 Up Trend,
- (Medium-Term) 55 Week: Approximately 2484.5 Down Trend,
- (Far-Term) 100 Week: Approximately 2848 Down Trend,
- (Far-Term) 200 Week: 2967 Down Trend.
Recent Trade Signals
- 17 Nov 2026: Short ETH 11-26 @ 1788.5 Signals.USAR-WSFG
Overall Rating
- Near-Term: Bearish,
- Medium-Term: Bearish,
- Far-Term: Bearish.
Key Insights Summary
From a futures swing-trading perspective, the dominant feature is renewed downside expansion following the failed recovery to 2838. Price has returned toward the evolving 1711.5 pivot low, with 1564 remaining the lower established support. Both pivot trend summaries are bearish, and price is below all six weekly benchmarks. The rising 20-week average is a lagging counterpoint rather than confirmation of the latest decline; the 200-week benchmark is essentially flat. The positive weekly grid reading represents a limited near-term countertrend element against negative monthly and yearly grids and the latest short signal. The 2196.5 opposite-pivot reversal threshold marks the chart's near-term structural reference. Overall, the chart depicts a sharp retracement of the summer rebound within a broadly bearish structure, not a confirmed bullish reversal. No accompanying news or seasonal evidence establishes a separate catalyst.
Chart Analysis ATS AI Generated: 2026-11-17 07:06 for Informational use only, not trading advice. Terms and Risk Disclosure Copyright © 2026. Algo Trading Systems LLC.