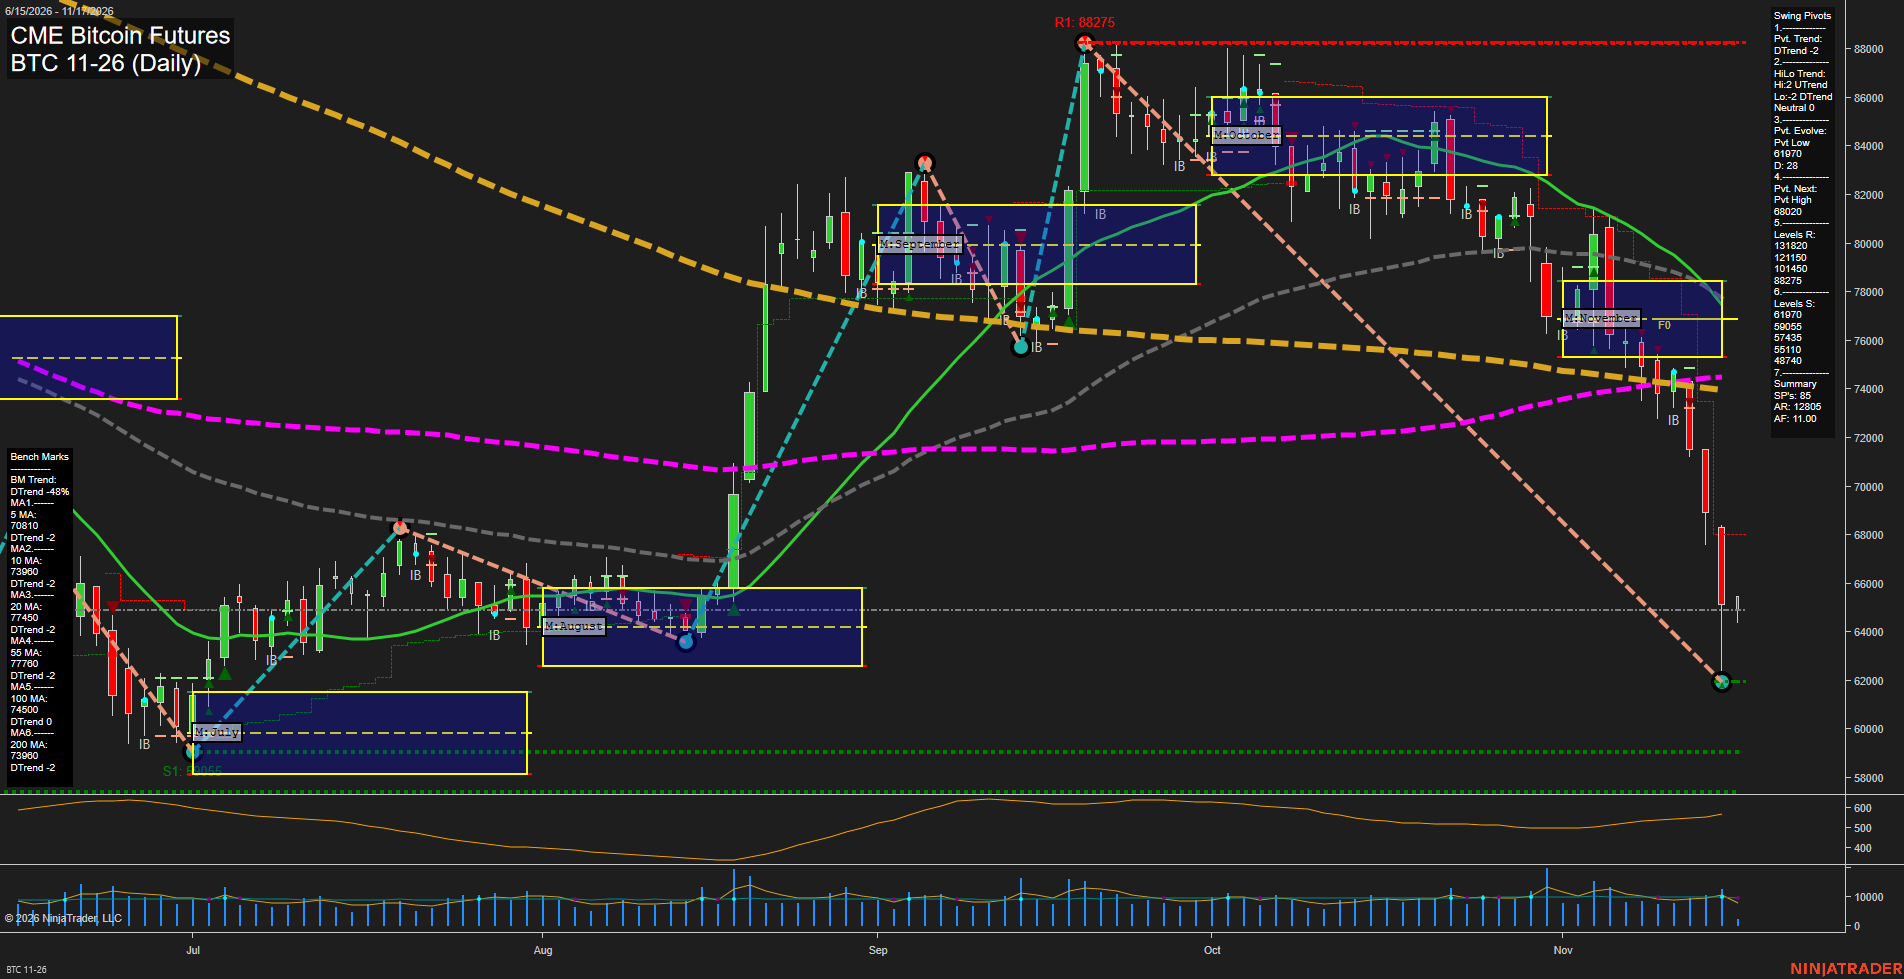
BTC CME Bitcoin Futures Daily Chart Analysis — Pre-Open: 2026-Nov-17 07:03 CT
Price Action
- Last: approximately 64900,
- Bars: Large,
- Mom: Momentum fast.
WSFG Weekly
- Near-Term
- WSFG Current: 4%
- F0%/NTZ' Bias: Price Above,
- WSFG Trend: Up.
MSFG Month Nov
- Medium-Term
- MSFG Current: -89%
- F0%/NTZ' Bias: Price Below,
- MSFG Trend: Down.
YSFG Year 2026
- Far-Term
- YSFG Current: -92%
- F0%/NTZ' Bias: Price Below,
- YSFG Trend: Down.
Swing Pivots
- (Near-Term) 1. Pvt. Trend: DTrend,
- (Medium-Term) 2. HiLo Trend: Neutral (highs UTrend; lows DTrend),
- 3. Pvt. Evolve: Pvt low 61970,
- 4. Pvt. Next: Pvt high 68020,
- 5. Levels R: 131820, 121150, 101450, 88275,
- 6. Levels S: 61970, 59055, 57435, 55110, 48740.
Daily Benchmarks
- (Near-Term) 5 Day: 70810 Down Trend,
- (Near-Term) 10 Day: 73980 Down Trend,
- (Medium-Term) 20 Day: 77450 Down Trend,
- (Medium-Term) 55 Day: 77760 Down Trend,
- (Far-Term) 100 Day: 74500 Flat Trend,
- (Far-Term) 200 Day: 73980 Down Trend.
Additional Metrics
Recent Trade Signals
- 17 Nov 2026: Short BTC 11-26 @ 64555 Signals.USAR-WSFG
- 09 Nov 2026: Short BTC 11-26 @ 74740 Signals.USAR-MSFG
Overall Rating
- Near-Term: Bearish,
- Medium-Term: Bearish,
- Far-Term: Bearish.
Key Insights Summary
The dominant swing structure is bearish, with an accelerating decline from 88275, expanding downside bars, and price below every benchmark average. The latest small bar follows substantial selling and does not yet establish a swing reversal. The evolving 61970 pivot low marks immediate structural support, followed by 59055 and 57435; 68020 is the next opposite-pivot reversal threshold, not a confirmed resistance pivot. November’s monthly balance area has broken downward, reinforcing the bearish monthly and yearly grid readings. The positive weekly grid reading represents a countertrend offset rather than broad trend confirmation, while both supplied trade signals are short. Mixed high/low pivot trends and a flat 100-day benchmark temper, but do not overturn, the bearish assessment. News and seasonal catalysts cannot be established from this chart alone.
Chart Analysis ATS AI Generated: 2026-11-17 07:03 for Informational use only, not trading advice. Terms and Risk Disclosure Copyright © 2026. Algo Trading Systems LLC.