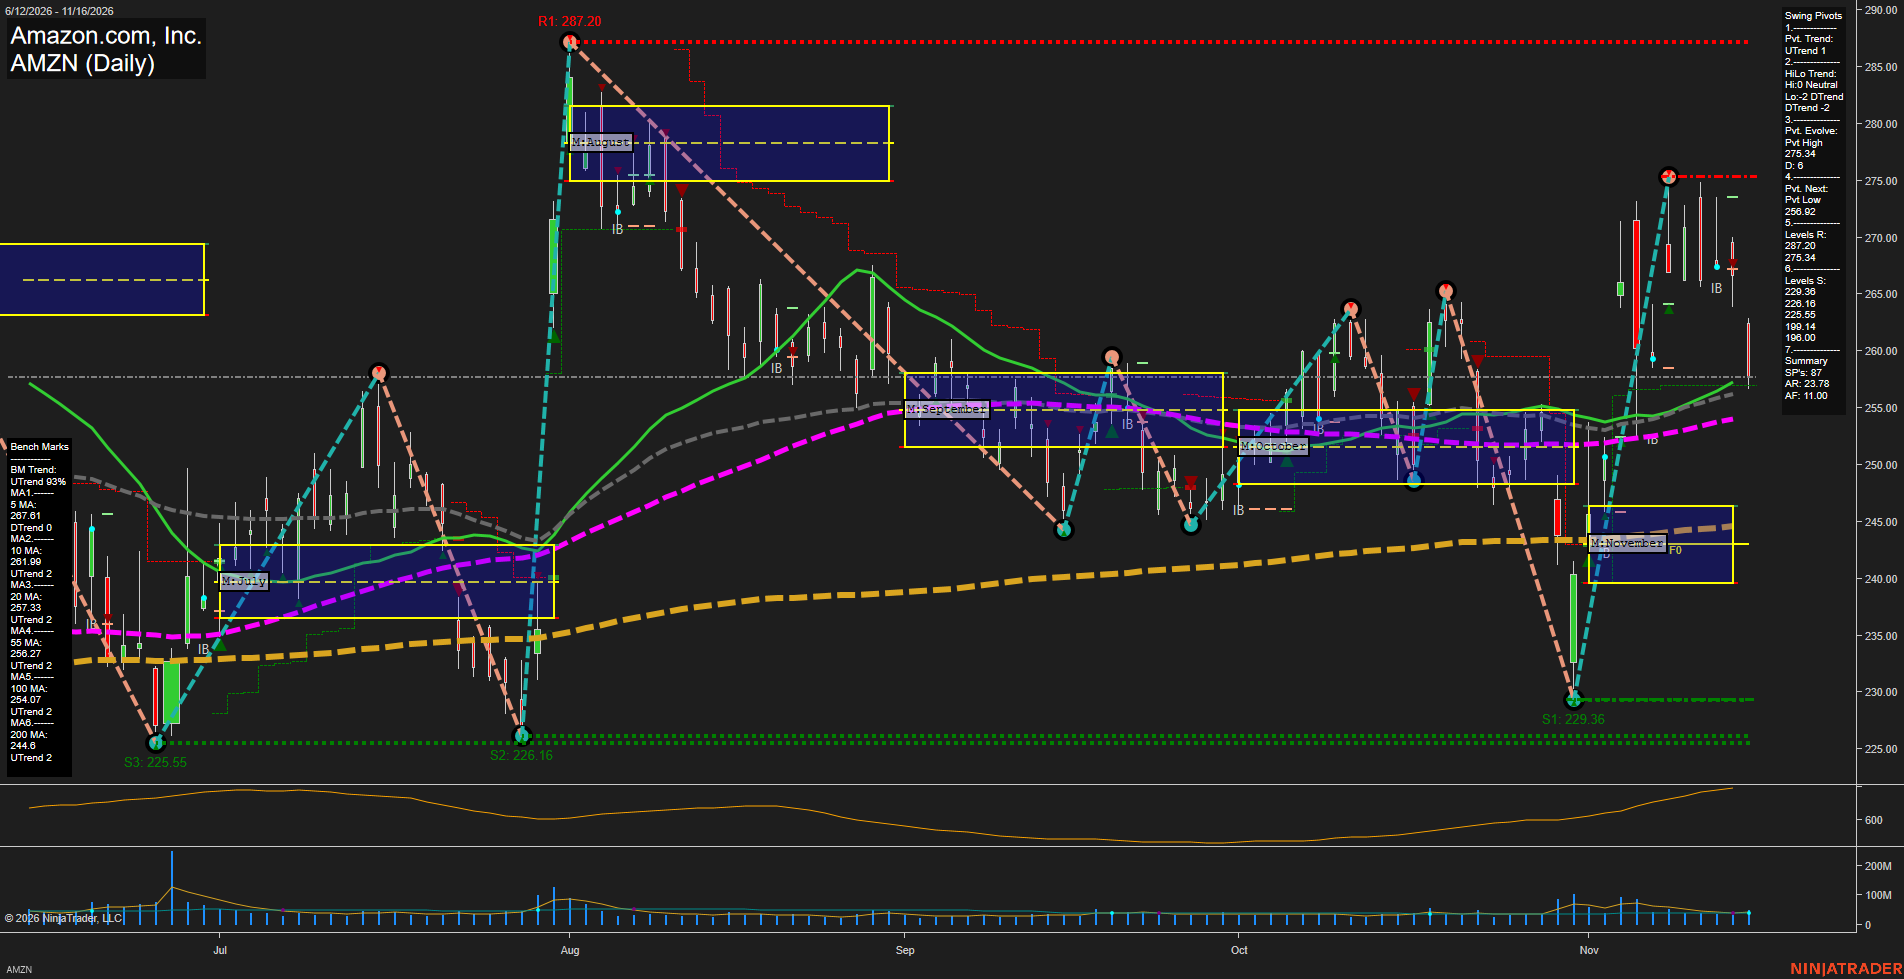
AMZN Amazon.com; Inc. Daily Chart Analysis — Pre-Open: 2026-Nov-17 07:02 CT
Price Action
- Last: Approximately 257.80,
- Bars: Large,
- Mom: Momentum fast to the downside.
WSFG Weekly
- Near-Term
- WSFG Current: NA%
- F0%/NTZ' Bias: Price Neutral,
- WSFG Trend: Neutral.
MSFG Month Nov
- Medium-Term
- MSFG Current: NA%
- F0%/NTZ' Bias: Price Bullish,
- MSFG Trend: Bullish.
YSFG Year 2026
- Far-Term
- YSFG Current: NA%
- F0%/NTZ' Bias: Price Neutral,
- YSFG Trend: Neutral.
Swing Pivots
- (Near-Term) 1. Pvt. Trend: UTrend,
- (Medium-Term) 2. HiLo Trend: DTrend,
- 3. Pvt. Evolve: Pvt high 275.34,
- 4. Pvt. Next: Pvt low 256.92,
- 5. Levels R: 287.20, 275.34,
- 6. Levels S: 229.36, 226.16, 225.55, 199.14, 196.00.
Daily Benchmarks
- (Near-Term) 5 Day: 267.61 Down Trend,
- (Near-Term) 10 Day: 261.99 Up Trend,
- (Medium-Term) 20 Day: 257.33 Up Trend,
- (Medium-Term) 55 Day: 256.27 Up Trend,
- (Far-Term) 100 Day: 254.07 Up Trend,
- (Far-Term) 200 Day: 244.60 Up Trend.
Additional Metrics
- ATR: 465,
- VOLMA: 33608198.
Overall Rating
- Near-Term: Neutral,
- Medium-Term: Bullish,
- Far-Term: Bullish.
Key Insights Summary
From a futures swing trader’s perspective, AMZN shows a fast countertrend retracement after its sharp November recovery from 229.36 to 275.34. Price has lost the 5- and 10-day benchmarks and is testing the closely grouped 20- and 55-day averages around 256–257. The near-term pivot remains UTrend, but 256.92 is the displayed reversal threshold for a new pivot low. Medium-term evidence favors a bullish rating through rising benchmarks and price above November’s monthly neutral zone, although the HiLo pivot structure remains bearish. Rising 100- and 200-day averages support the broader bullish backdrop. Resistance remains at 275.34 and 287.20; the listed confirmed swing supports lie substantially below current price. Expanding recent ranges and rising ATR indicate a higher-volatility swing environment rather than orderly consolidation. Weekly and yearly grids, named trade-signal outputs, and news catalysts are not visible, so their direction cannot be independently confirmed. The supplied ATR and VOLMA values are retained because exact current readings are not legible.
Chart Analysis ATS AI Generated: 2026-11-17 07:02 for Informational use only, not trading advice. Terms and Risk Disclosure Copyright © 2026. Algo Trading Systems LLC.