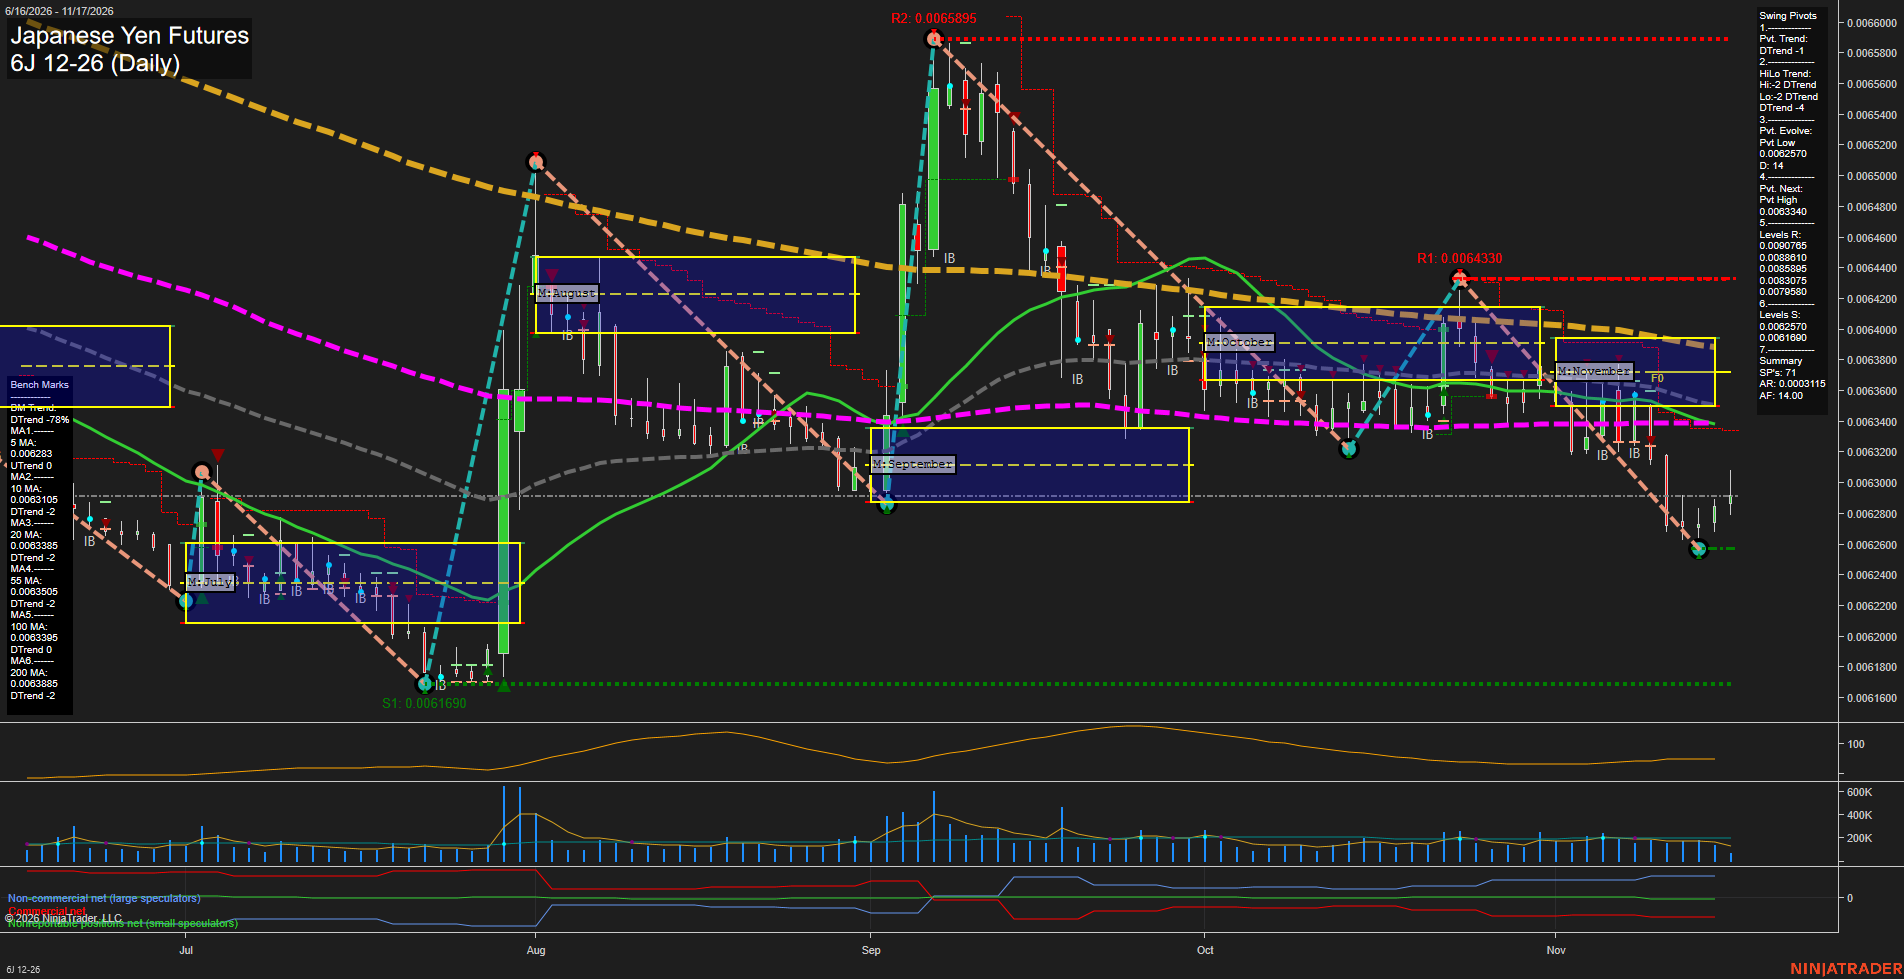
6J Japanese Yen Futures Daily Chart Analysis — Pre-Open: 2026-Nov-17 07:01 CT
Price Action
- Last: Approximately 0.0062920,
- Bars: Small,
- Mom: Momentum slow.
WSFG Weekly
- Near-Term
- WSFG Current: 22%
- F0%/NTZ' Bias: Price Above,
- WSFG Trend: Up.
MSFG Month Nov
- Medium-Term
- MSFG Current: -36%
- F0%/NTZ' Bias: Price Below,
- MSFG Trend: Down.
YSFG Year 2026
- Far-Term
- YSFG Current: -25%
- F0%/NTZ' Bias: Price Below,
- YSFG Trend: Down.
Swing Pivots
- (Near-Term) 1. Pvt. Trend: DTrend,
- (Medium-Term) 2. HiLo Trend: DTrend,
- 3. Pvt. Evolve: Pvt low 0.0062570,
- 4. Pvt. Next: Pvt high 0.0063340,
- 5. Levels R: 0.0090765, 0.0088610, 0.0085895, 0.0083075, 0.0079580,
- 6. Levels S: 0.0062570, 0.0061690.
Daily Benchmarks
- (Near-Term) 5 Day: 0.0062830 Up Trend,
- (Near-Term) 10 Day: 0.0063105 Down Trend,
- (Medium-Term) 20 Day: 0.0063385 Down Trend,
- (Medium-Term) 55 Day: 0.0063505 Down Trend,
- (Far-Term) 100 Day: 0.0063395 Down Trend,
- (Far-Term) 200 Day: 0.0063885 Down Trend.
Additional Metrics
Recent Trade Signals
- 17 Nov 2026: Long 6J 12-26 @ 0.0062875 Signals.USAR-WSFG
- 10 Nov 2026: Short 6J 12-26 @ 0.0063185 Signals.USAR.TR120
Overall Rating
- Near-Term: Neutral,
- Medium-Term: Bearish,
- Far-Term: Bearish.
Key Insights Summary
The yen is staging a small countertrend bounce from 0.0062570 within a broader declining swing structure. Weekly grid strength, the rising five-day benchmark and the latest weekly long signal contrast with the falling near-term pivot trend, declining ten-day benchmark and earlier TR120 short signal. Small recent candles suggest measured recovery rather than forceful upside momentum. Price remains below the monthly neutral zone and every benchmark from ten through 200 days, reinforcing bearish medium- and far-term conditions. The next pivot reversal reference is 0.0063340, near the clustered 20- and 100-day benchmarks; visible chart resistance also sits at 0.0064330 and 0.0065895. These nearby plotted resistance levels differ from the distant resistance entries displayed in the Swing Pivots summary. Support remains 0.0062570, followed by 0.0061690. Overall, this is an early rebound within an established downtrend, not yet a confirmed broader reversal; the image alone does not establish a news or seasonal catalyst.
Chart Analysis ATS AI Generated: 2026-11-17 07:01 for Informational use only, not trading advice. Terms and Risk Disclosure Copyright © 2026. Algo Trading Systems LLC.