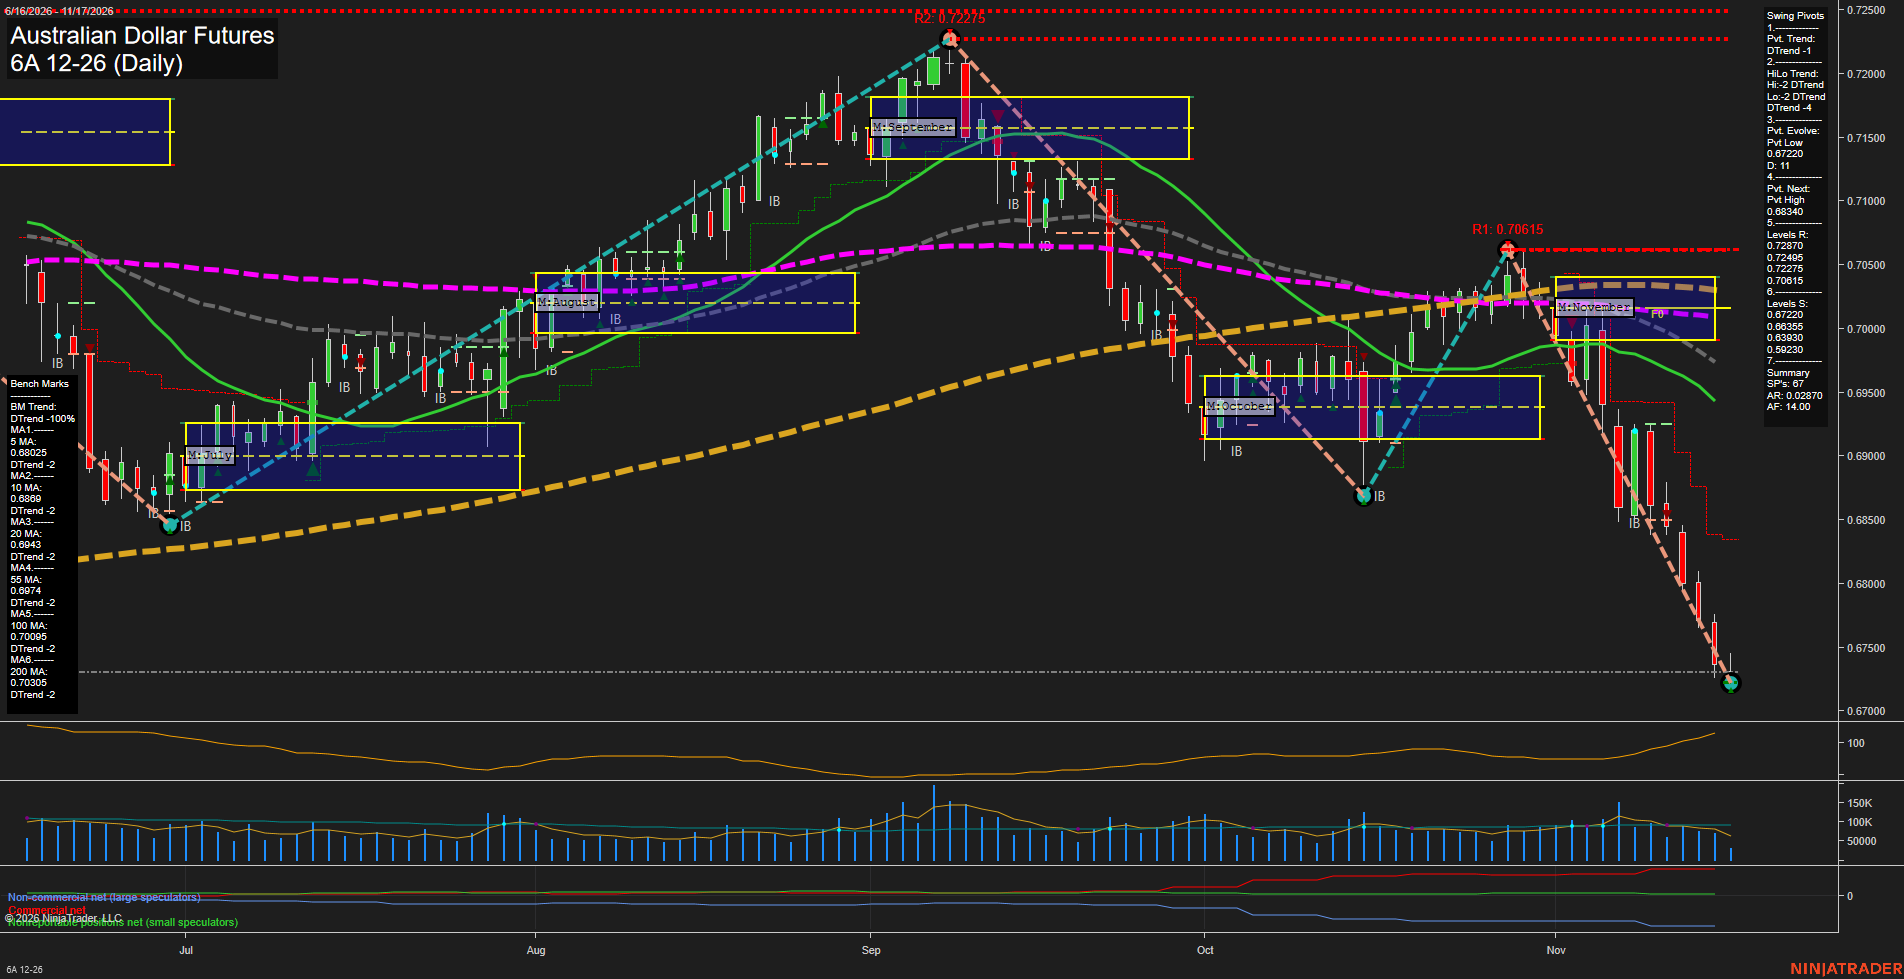
6A Australian Dollar Futures Daily Chart Analysis — Pre-Open: 2026-Nov-17 07:00 CT
Price Action
- Last: Approximately 0.67300,
- Bars: Large,
- Mom: Momentum fast.
WSFG Weekly
- Near-Term
- WSFG Current: -32%
- F0%/NTZ' Bias: Price Below,
- WSFG Trend: Down.
MSFG Month Nov
- Medium-Term
- MSFG Current: -136%
- F0%/NTZ' Bias: Price Below,
- MSFG Trend: Down.
YSFG Year 2026
- Far-Term
- YSFG Current: 5%
- F0%/NTZ' Bias: Price Above,
- YSFG Trend: Up.
Swing Pivots
- (Near-Term) 1. Pvt. Trend: DTrend,
- (Medium-Term) 2. HiLo Trend: DTrend,
- 3. Pvt. Evolve: Pvt low 0.67220,
- 4. Pvt. Next: Pvt high 0.68340,
- 5. Levels R: 0.72870, 0.72495, 0.72275, 0.70615,
- 6. Levels S: 0.67220, 0.66355, 0.63930, 0.59230.
Daily Benchmarks
- (Near-Term) 5 Day: 0.68025 Down Trend,
- (Near-Term) 10 Day: 0.68690 Down Trend,
- (Medium-Term) 20 Day: 0.69430 Down Trend,
- (Medium-Term) 55 Day: 0.69740 Down Trend,
- (Far-Term) 100 Day: 0.70095 Down Trend,
- (Far-Term) 200 Day: 0.70305 Down Trend.
Additional Metrics
Recent Trade Signals
- 16 Nov 2026: Short 6A 12-26 @ 0.6752 Signals.USAR-WSFG
- 10 Nov 2026: Short 6A 12-26 @ 0.68435 Signals.USAR.TR120
Overall Rating
- Near-Term: Bearish,
- Medium-Term: Bearish,
- Far-Term: Bearish.
Key Insights Summary
From a futures swing trader’s perspective, the chart shows bearish trend continuation following the late-October rebound and rejection at 0.70615. Lower highs and lower lows, price beneath all six declining benchmarks, and negative weekly and monthly grids reinforce the downside structure. Recent short signals align with that structure. Large declining bars and rising ATR indicate an expanding-volatility selloff rather than orderly consolidation, although the latest small bar near 0.67220 suggests a temporary pause without a confirmed reversal. The evolving pivot low is 0.67220, with the next listed support at 0.66355; 0.68340 is the summary’s next opposite-pivot reversal threshold. Far-term evidence is mixed because the yearly grid remains positive, but declining 100- and 200-day benchmarks give the majority assessment a bearish reading. News catalysts and seasonal influences cannot be established from this chart alone.
Chart Analysis ATS AI Generated: 2026-11-17 07:00 for Informational use only, not trading advice. Terms and Risk Disclosure Copyright © 2026. Algo Trading Systems LLC.