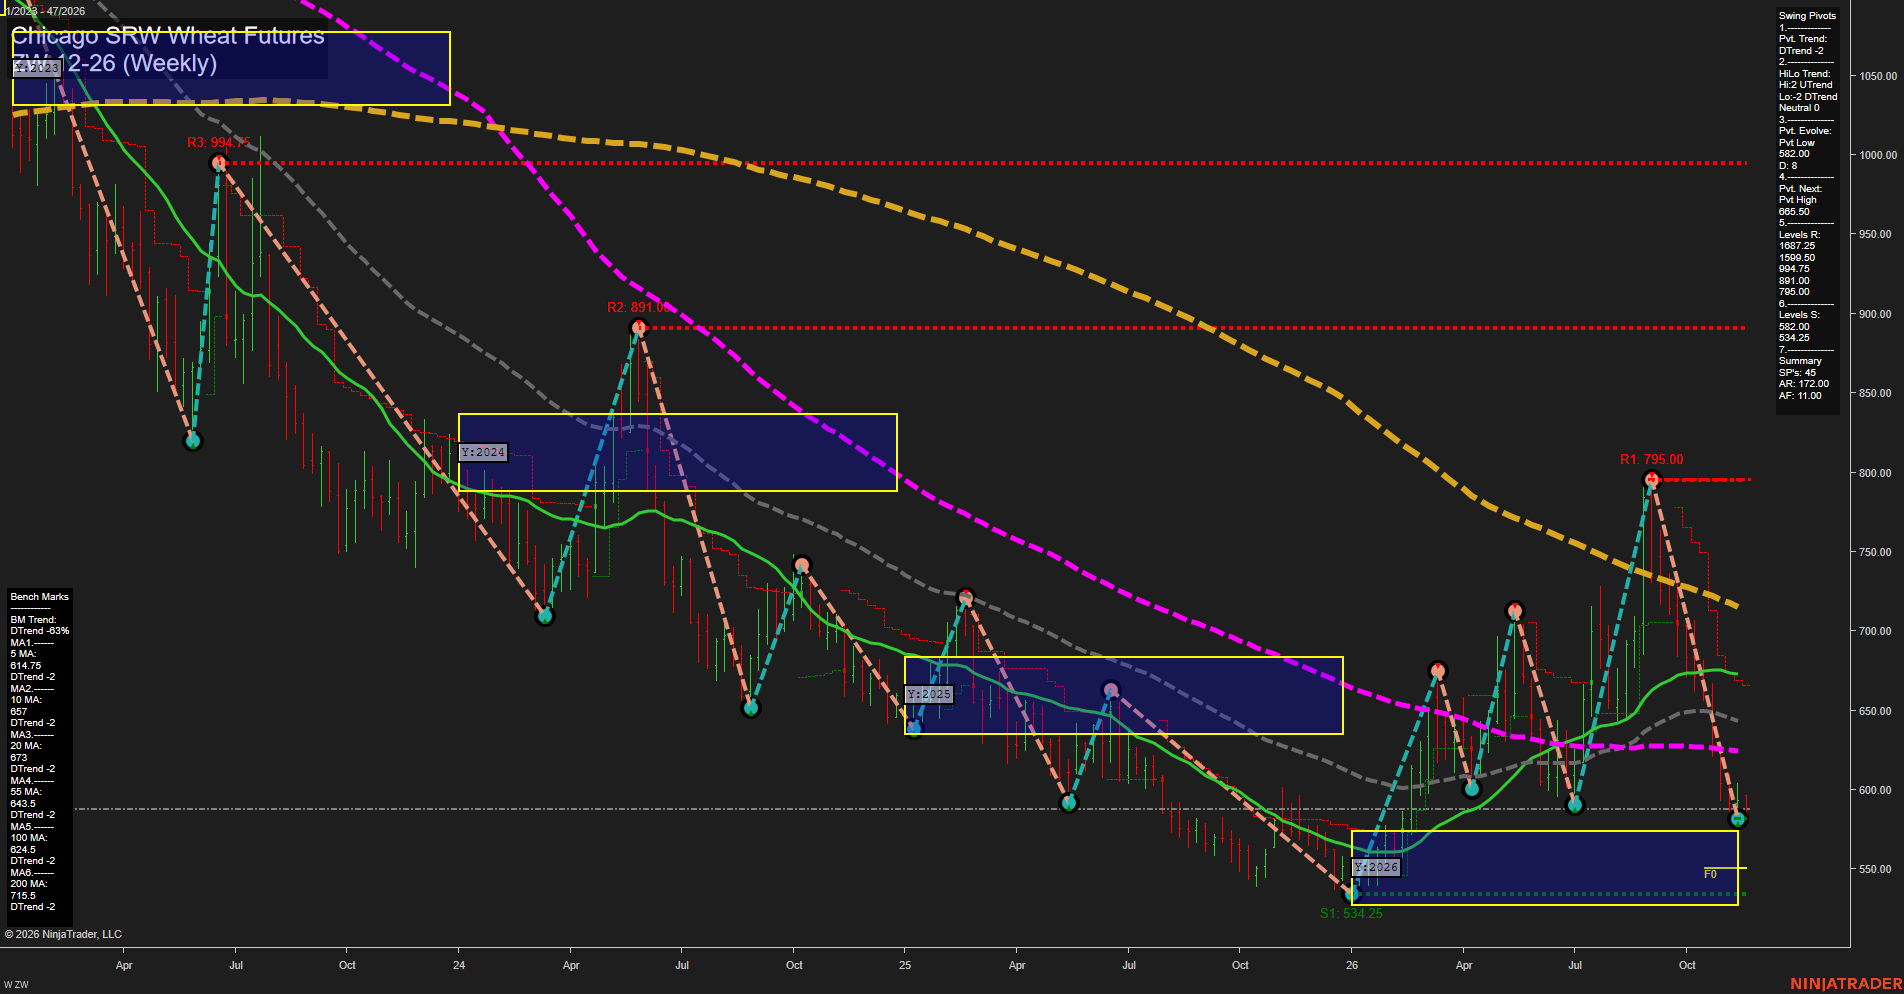
ZW Chicago SRW Wheat Futures Weekly Chart Analysis — After Market Close: 2026-Nov-16 15:18 CT
Price Action
- Last: approximately 589.5,
- Bars: Large,
- Mom: Momentum fast.
WSFG Weekly
- Near-Term
- WSFG Current: -27%
- F0%/NTZ' Bias: Price Below,
- WSFG Trend: Down.
MSFG Month Nov
- Medium-Term
- MSFG Current: -13%
- F0%/NTZ' Bias: Price Below,
- MSFG Trend: Down.
YSFG Year 2026
- Far-Term
- YSFG Current: 15%
- F0%/NTZ' Bias: Price Above,
- YSFG Trend: Up.
Swing Pivots
- (Near-Term) 1. Pvt. Trend: DTrend,
- (Medium-Term) 2. HiLo Trend: Neutral,
- 3. Pvt. Evolve: Pvt low 582.00,
- 4. Pvt. Next: Pvt high 665.50,
- 5. Levels R: 1687.25, 1599.50, 994.75, 891.00, 795.00,
- 6. Levels S: 582.00, 534.25.
Weekly Benchmarks
- (Near-Term) 5 Week: 614.75 Down Trend,
- (Near-Term) 10 Week: 657.00 Down Trend,
- (Medium-Term) 20 Week: 673.00 Down Trend,
- (Medium-Term) 55 Week: 643.50 Down Trend,
- (Far-Term) 100 Week: 624.50 Down Trend,
- (Far-Term) 200 Week: 715.50 Down Trend.
Recent Trade Signals
- 16 Nov 2026: Short ZW 12-26 @ 589.5 Signals.USAR-MSFG
- 13 Nov 2026: Long ZW 12-26 @ 597 Signals.USAR-WSFG
- 11 Nov 2026: Long ZW 12-26 @ 602.25 Signals.USAR.TR120
Overall Rating
- Near-Term: Bearish,
- Medium-Term: Bearish,
- Far-Term: Bearish.
Key Insights Summary
The sharp reversal from 795.00 has returned wheat to the 582.00 support area, leaving price below all six declining weekly benchmarks. Large selloff bars indicate strong downside momentum, although the latest bars show some contraction near support. Near-term conditions remain bearish despite the two recent long signals; the subsequent monthly-grid short signal reinforces the broader decline. The pivot summary explicitly classifies the medium-term HiLo structure as neutral, with rising highs offset by falling lows, consistent with volatile, two-way swings rather than an orderly trend. Support is concentrated at 582.00 and the yearly low of 534.25; 614.75 is the nearest overhead benchmark, while 665.50 is the stated next-pivot reversal threshold. The positive yearly grid remains a counterweight, with price above its neutral zone, but declining long-term averages keep the far-term balance bearish. No far-term TR720 signal or verified news and seasonal catalysts are supplied, so those factors cannot be assessed from this chart.
Chart Analysis ATS AI Generated: 2026-11-16 15:18 for Informational use only, not trading advice. Terms and Risk Disclosure Copyright © 2026. Algo Trading Systems LLC.