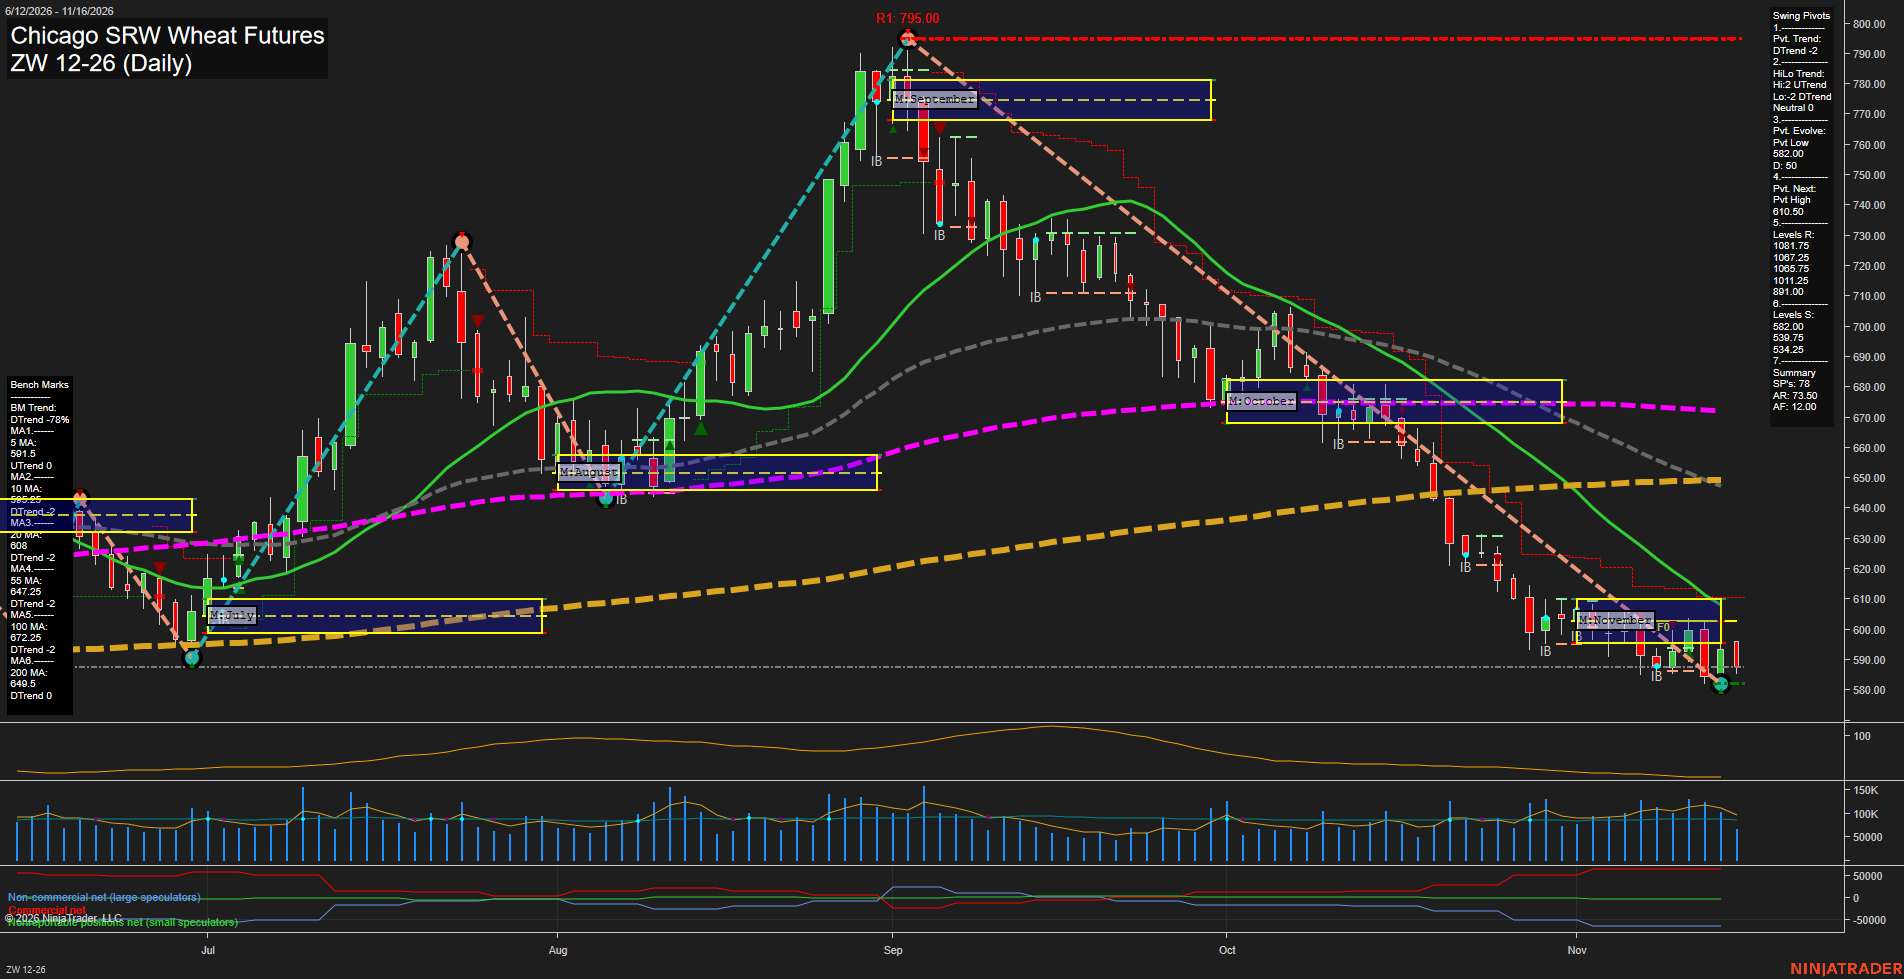
ZW Chicago SRW Wheat Futures Daily Chart Analysis — After Market Close: 2026-Nov-16 15:17 CT
Price Action
- Last: Approximately 588,
- Bars: Small,
- Mom: Momentum slow.
WSFG Weekly
- Near-Term
- WSFG Current: -27%
- F0%/NTZ' Bias: Price Below,
- WSFG Trend: Down.
MSFG Month Nov
- Medium-Term
- MSFG Current: -13%
- F0%/NTZ' Bias: Price Below,
- MSFG Trend: Down.
YSFG Year 2026
- Far-Term
- YSFG Current: 15%
- F0%/NTZ' Bias: Price Above,
- YSFG Trend: Up.
Swing Pivots
- (Near-Term) 1. Pvt. Trend: DTrend,
- (Medium-Term) 2. HiLo Trend: Neutral (highs UTrend; lows DTrend),
- 3. Pvt. Evolve: Pvt low 582.00,
- 4. Pvt. Next: Pvt high 610.50,
- 5. Levels R: 1081.75, 1067.25, 1065.75, 1011.25, 891.00,
- 6. Levels S: 582.00, 539.75, 534.25.
Daily Benchmarks
- (Near-Term) 5 Day: 591.5 Up Trend,
- (Near-Term) 10 Day: 595.25 Down Trend,
- (Medium-Term) 20 Day: 608 Down Trend,
- (Medium-Term) 55 Day: 647.25 Down Trend,
- (Far-Term) 100 Day: 672.25 Down Trend,
- (Far-Term) 200 Day: 649.5 Down Trend.
Additional Metrics
Recent Trade Signals
- 16 Nov 2026: Short ZW 12-26 @ 589.5 Signals.USAR-MSFG
- 13 Nov 2026: Long ZW 12-26 @ 597 Signals.USAR-WSFG
- 11 Nov 2026: Long ZW 12-26 @ 602.25 Signals.USAR.TR120
Overall Rating
- Near-Term: Bearish,
- Medium-Term: Bearish,
- Far-Term: Bearish.
Key Insights Summary
Price remains in the sustained decline from September's 795 high, with lower swing lows and repeated failed rebounds characterizing the recent structure. The latest downswing is testing the evolving 582 pivot low, while price remains below November's NTZ and all six daily benchmarks. The rising five-day average is an isolated stabilization signal rather than broad trend confirmation. Recent near-term long signals have been followed by a fresh monthly-grid short signal, reflecting an unsuccessful countertrend rebound. The 610.50 opposite-pivot threshold and 608 twenty-day average define nearby overhead structure; the summary's listed resistance levels are much more distant historical references. Far-term evidence is mixed because the yearly grid remains positive, but both long-term benchmarks slope downward. Smaller bars and a declining ATR plot indicate slower movement near the lows rather than an accelerating selloff. The chart alone does not establish a news or seasonal catalyst.
Chart Analysis ATS AI Generated: 2026-11-16 15:18 for Informational use only, not trading advice. Terms and Risk Disclosure Copyright © 2026. Algo Trading Systems LLC.