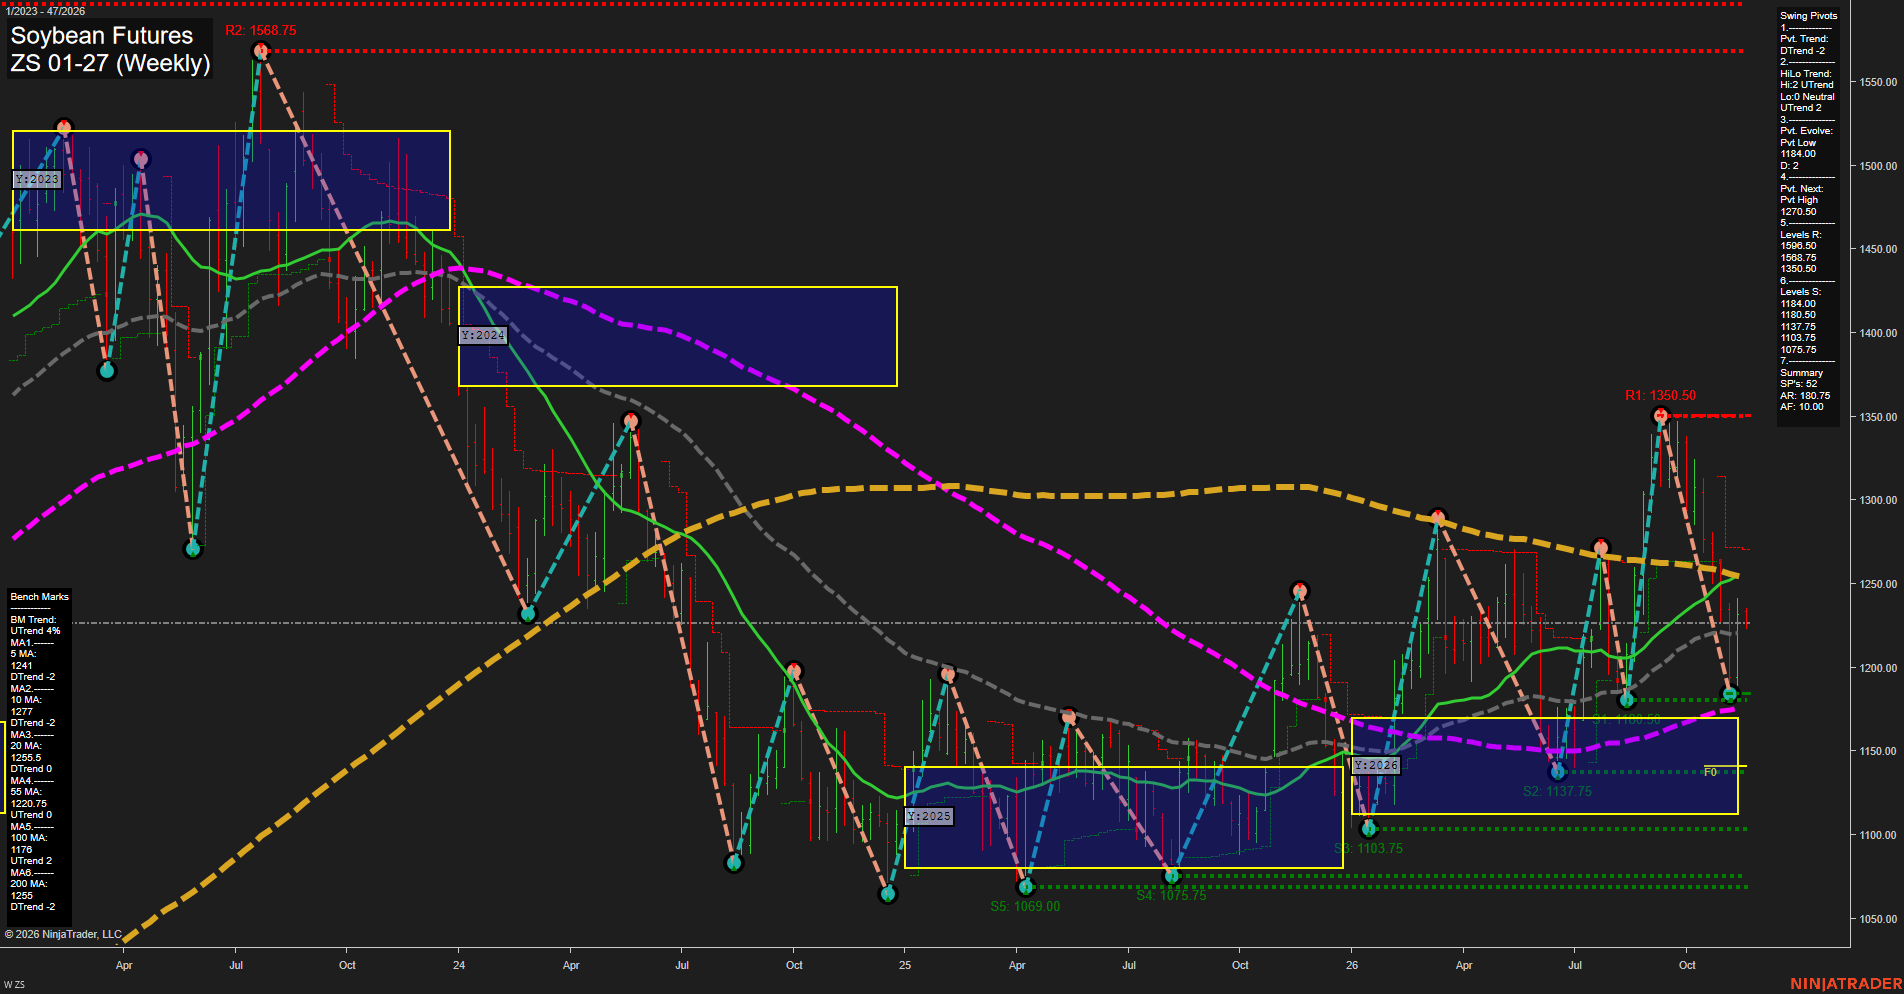
ZS Soybean Futures Weekly Chart Analysis — After Market Close: 2026-Nov-16 15:17 CT
Price Action
- Last: Approximately 1227,
- Bars: Medium,
- Mom: Momentum slow.
WSFG Weekly
- Near-Term
- WSFG Current: -14%
- F0%/NTZ' Bias: Price Below,
- WSFG Trend: Down.
MSFG Month Nov
- Medium-Term
- MSFG Current: -8%
- F0%/NTZ' Bias: Price Below,
- MSFG Trend: Down.
YSFG Year 2026
- Far-Term
- YSFG Current: 30%
- F0%/NTZ' Bias: Price Above,
- YSFG Trend: Up.
Swing Pivots
- (Near-Term) 1. Pvt. Trend: DTrend,
- (Medium-Term) 2. HiLo Trend: UTrend,
- 3. Pvt. Evolve: Pvt low 1184.00,
- 4. Pvt. Next: Pvt high 1270.50,
- 5. Levels R: 1596.50, 1568.75, 1350.50,
- 6. Levels S: 1184.00, 1180.50, 1137.75, 1103.75, 1075.75.
Weekly Benchmarks
- (Near-Term) 5 Week: 1241 Down Trend,
- (Near-Term) 10 Week: 1277 Down Trend,
- (Medium-Term) 20 Week: 1255.5 Down Trend,
- (Medium-Term) 55 Week: 1220.75 Up Trend,
- (Far-Term) 100 Week: 1176 Up Trend,
- (Far-Term) 200 Week: 1255 Down Trend.
Recent Trade Signals
- 10 Nov 2026: Long ZS 01-27 @ 1225.5 Signals.USAR.TR120
- 10 Nov 2026: Short ZS 01-27 @ 1188.25 Signals.USAR-WSFG
Overall Rating
- Near-Term: Bearish,
- Medium-Term: Neutral,
- Far-Term: Bullish.
Key Insights Summary
The weekly structure shows a near-term correction within a broader recovery. The retreat from 1350.50 established an evolving pivot low at 1184.00, slightly above the preceding 1180.50 low. Price has rebounded toward 1227, but remains below the declining 5- and 10-week benchmarks; negative weekly and monthly grids reinforce the bearish near-term balance despite conflicting recent trade signals. Medium-term conditions are mixed, with the higher-high/higher-low summary and rising 55-week average offset by the declining 20-week average and negative monthly grid. The 1255–1277 area concentrates several overhead benchmarks and the 1270.50 pivot-reversal threshold. Farther out, price remains above the yearly NTZ and rising 100-week average, supporting the recovery interpretation, although the declining 200-week average shows that the major trend has not fully aligned. The chart supports a choppy recovery with a corrective setback rather than a confirmed renewed upswing; no news or seasonal catalyst is established by the supplied image.
Chart Analysis ATS AI Generated: 2026-11-16 15:17 for Informational use only, not trading advice. Terms and Risk Disclosure Copyright © 2026. Algo Trading Systems LLC.